Analytics dashboard
The Analytics dashboard is available on paid plans.
The Analytics dashboard gives you a clear view of your account's key metrics. You can easily see what's happening across all your scenarios so you can stay on top of things and make informed decisions to optimize performance.
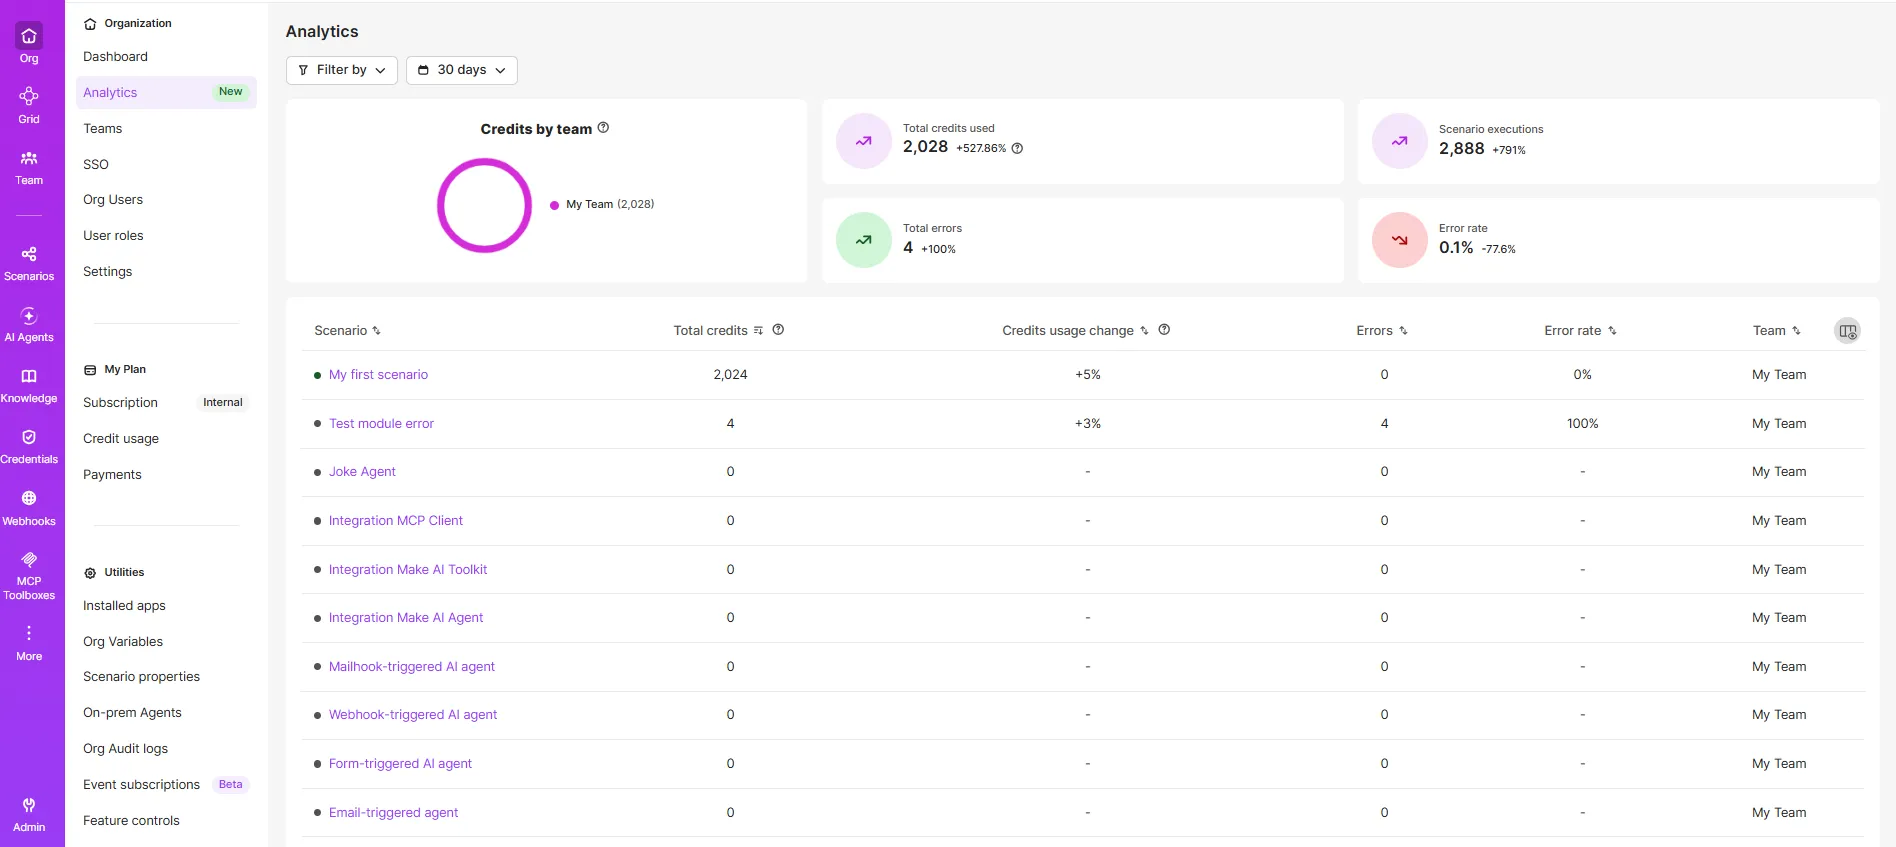
Dashboard features
The top of the dashboard shows key metrics for your organization:
- Credits by team
- Total credits used
- Scenario executions
- Total errors
- Error rate

The metrics next to Credits by team also show the percentage change compared to the previous time frame, along with an icon that shows the trend. For example, a down arrow next to the error rate means the error rate decreased.
Click Filter by to narrow the data by Status, Team, and Folders. The values available under Team and Folders vary depending on the organization. You can also change the time frame to view statistics for the last 24 hours, 7 days, 30 days, or a custom time frame.
To customize the columns displayed, select the column settings icon at the end of the table header.
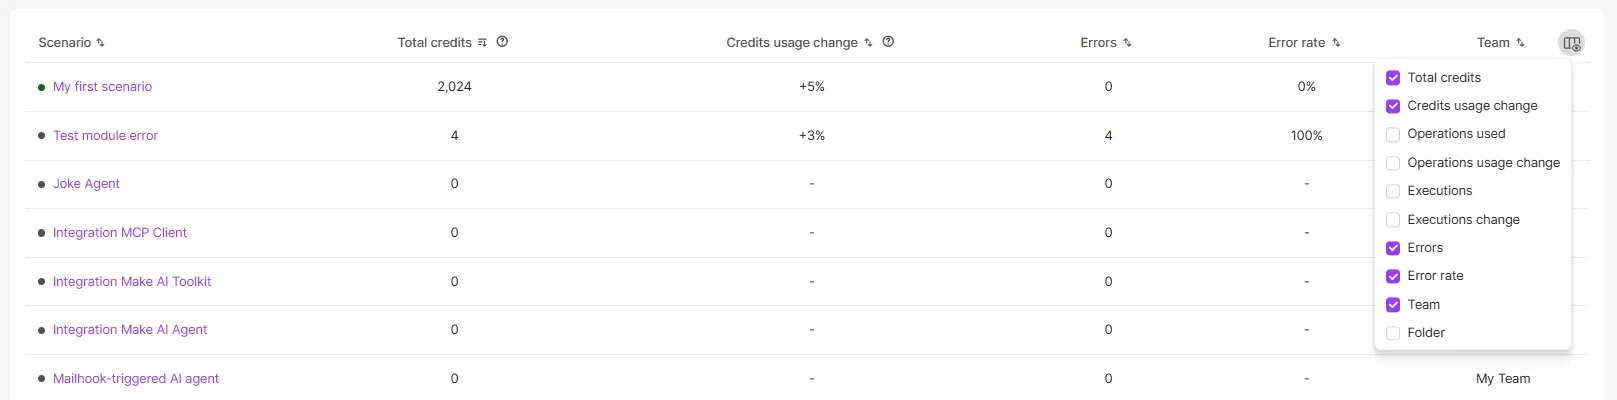
Column | Description |
|---|---|
Scenario | Existing and deleted scenarios. Deleted scenarios are gray. Each scenario has a dot indicating its status:
|
Total credits | The total number of credits used by a scenario in the selected time frame. |
Credits usage change | The percentage change in credits a scenario used compared to the previous time frame of the same length. For example, if a scenario used 5% more credits from November 1 to 10 than it did from October 22 to 31, the value is +5%. |
Executions | The total number of executions in a scenario in the selected time frame. |
Executions change | The percentage change in executions for a scenario compared to the previous time frame. |
Errors | The total number of errors in a scenario in the selected time frame. |
Error rate | The percentage of executions with errors in a scenario in the selected time frame. |
Team | The team associated with a scenario. |
Folder | The folder associated with a scenario. |