Explore Make Grid
Make Grid comes with easy to use navigation and interaction tools to view and customize the canvas.
Make Grid navigation and interaction tools
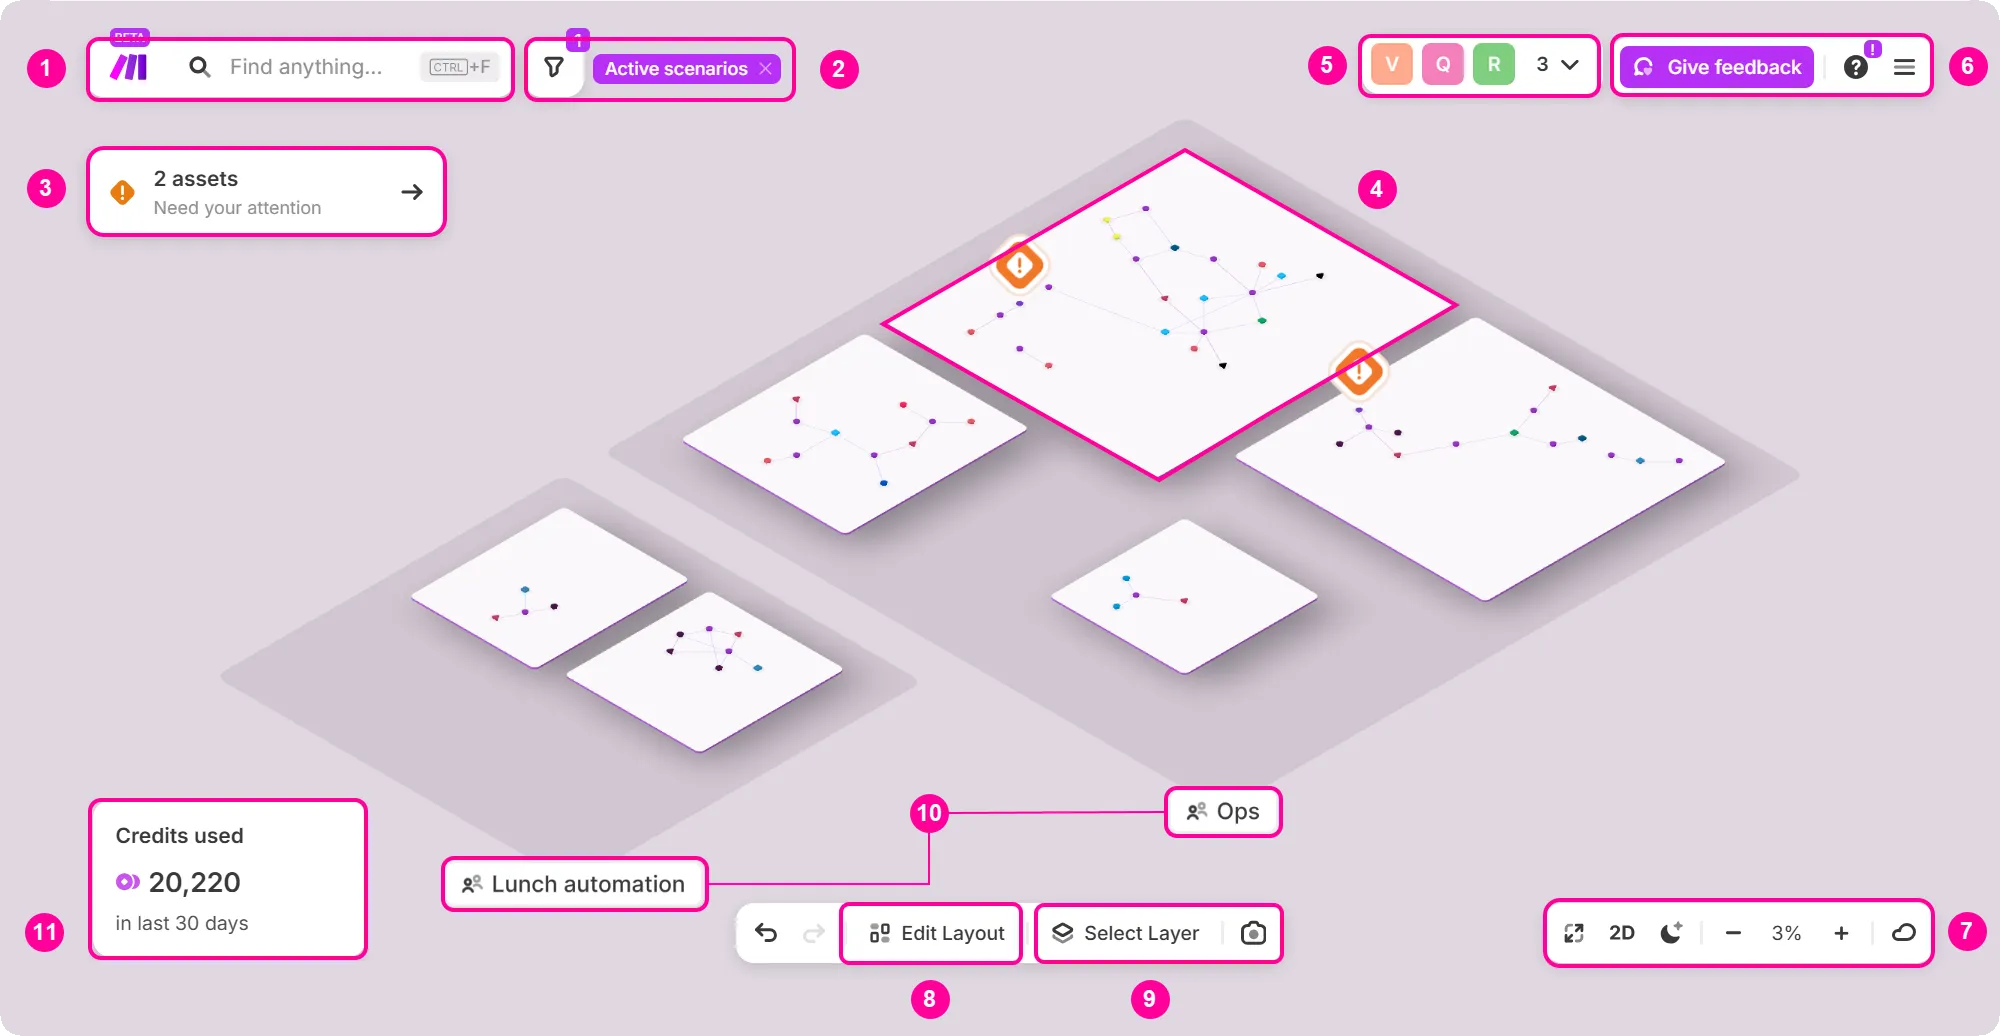
- Search
Use the search bar to scan scenario blueprints, including module configurations such as field values, URLs, scenario notes, and AI Agent system prompts. This means you can find scenarios by what's inside them, not just by name or app. Grid will immediately display the relevant scenarios and their dependencies.
- Filter
You can narrow down your search results by scenario properties such as status, folder, apps being used, creator, etc.
- Need your attention
You can view errors due to exceeded data store capacity, queued items in a webhook, deactivation or incomplete executions here. By clicking on the errors displayed, you can immediately locate where the error lies and resolve the issue.
- Islands
Each island represents a folder in your Make organization. When you zoom into an island, you can see the dependencies and scenarios that make up the island.
- Presence widget
You can see active team members and can see each other in real time. Active teammates are visible via live cursors and a presence widget in the toolbar, making it easier to collaborate.
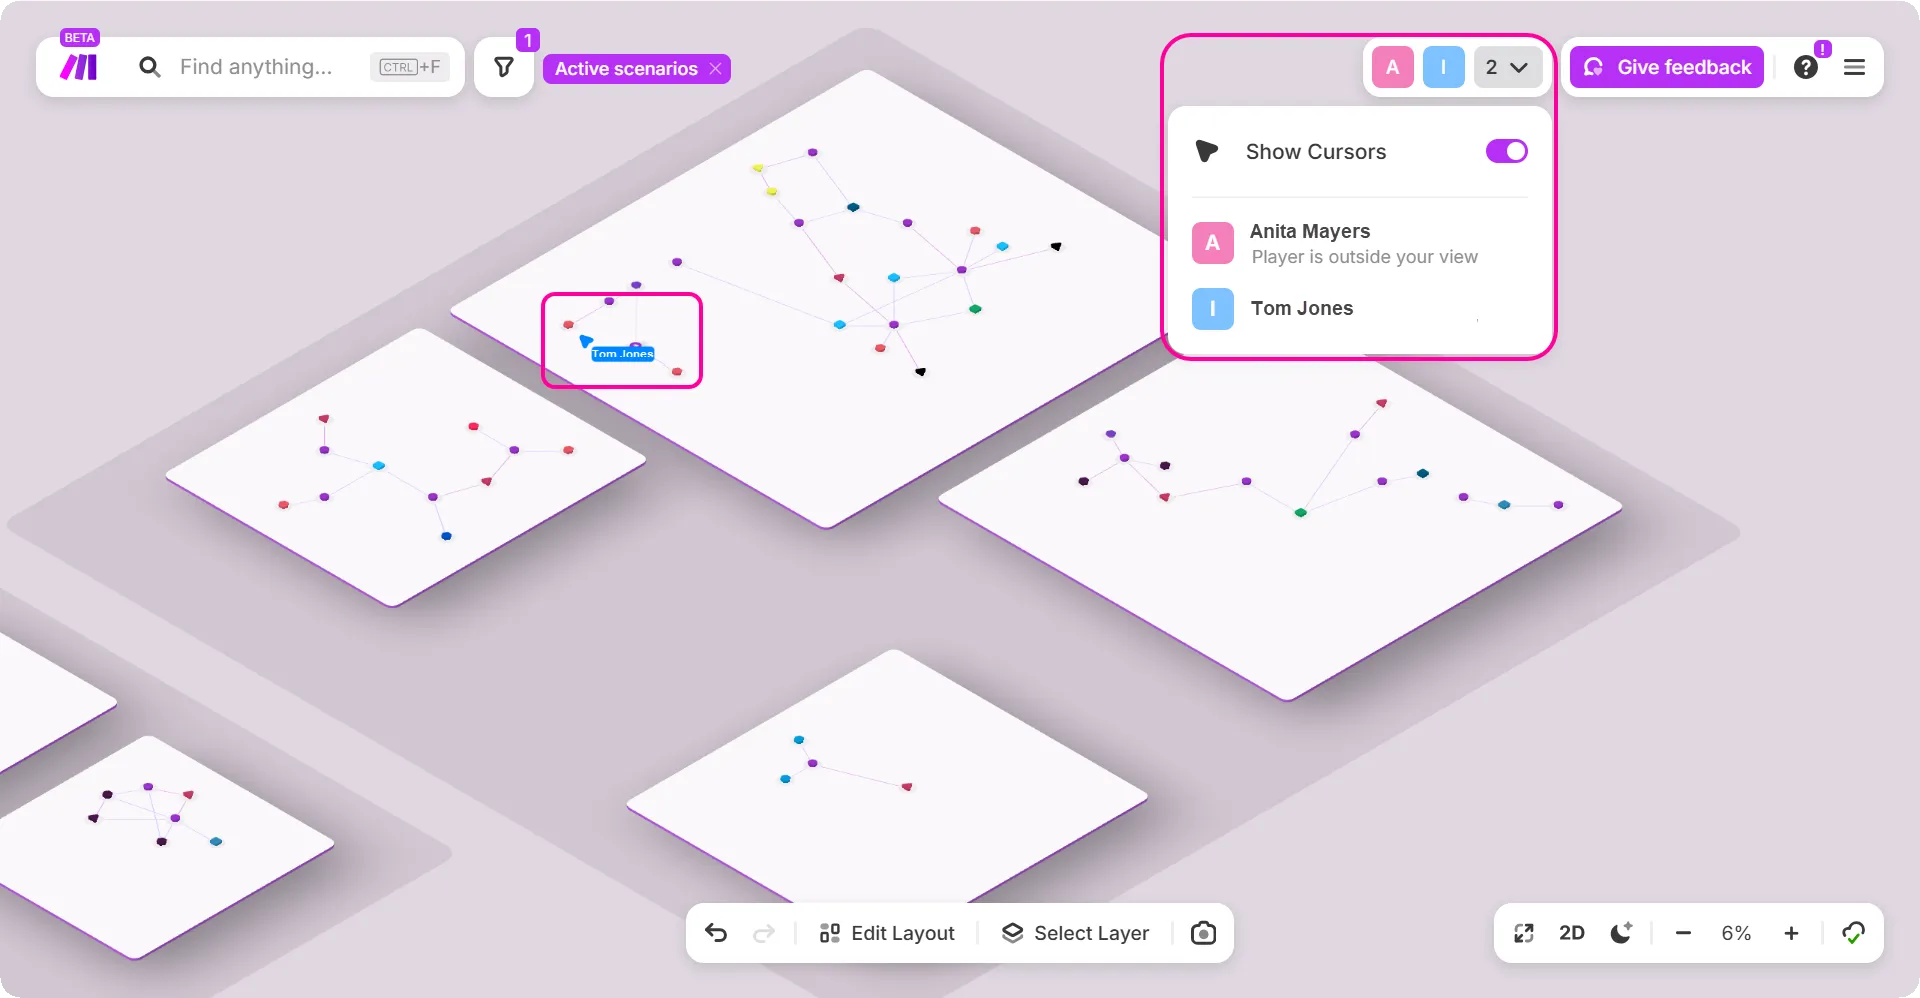
Toggle on and off the Show Cursors button to enable or disable the cursors.
- User support and feedback
You can submit feedback using the Give Feedback feature. Clicking the Resources icon will take you to the help resources of Make Grid. You can also view your organization and user details from the additional menu options.
- Modes, views, and zoom
Dashboard mode: In this mode, you can view the important metrics and data at a glance.
2D/3D view: You can switch between two and three dimensional views by toggling between 2D/3D button.
Dark/Light mode: Click the sun or moon icon to switch between light and dark visual themes.
Zoom: Use the +/- to zoom in and out of the Grid. Alternatively, scroll up/down or pinch on the trackpad to zoom.
Last update: The cloud icon displays the time elapsed since the last data synchronization, so you can always tell how current your data is at a glance.
- Edit Layout
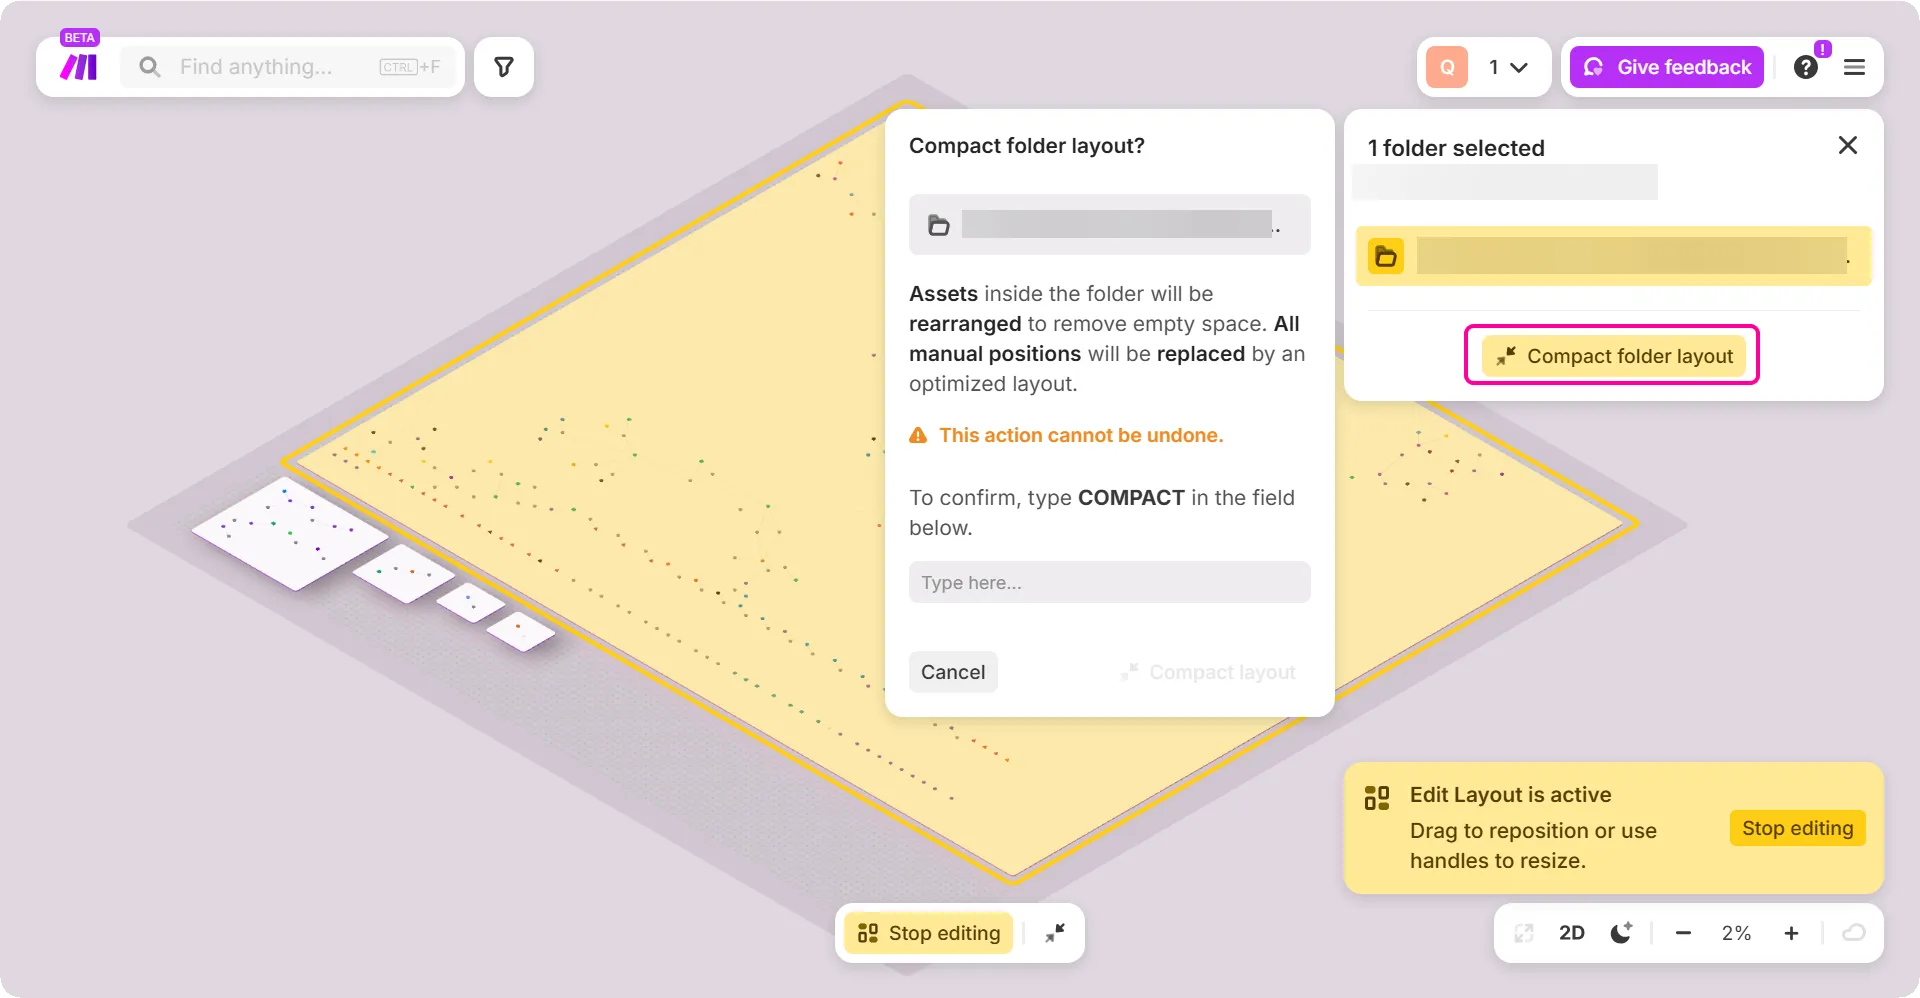
With the Edit Layout, you can customize your workspace layout to suit your workflow. Use the Edit Layout button in the toolbar to enter edit mode, where you can freely resize assets, folders (islands), or teams by dragging them into position. Use the yellow resize handles to adjust the size of folders and teams as needed.
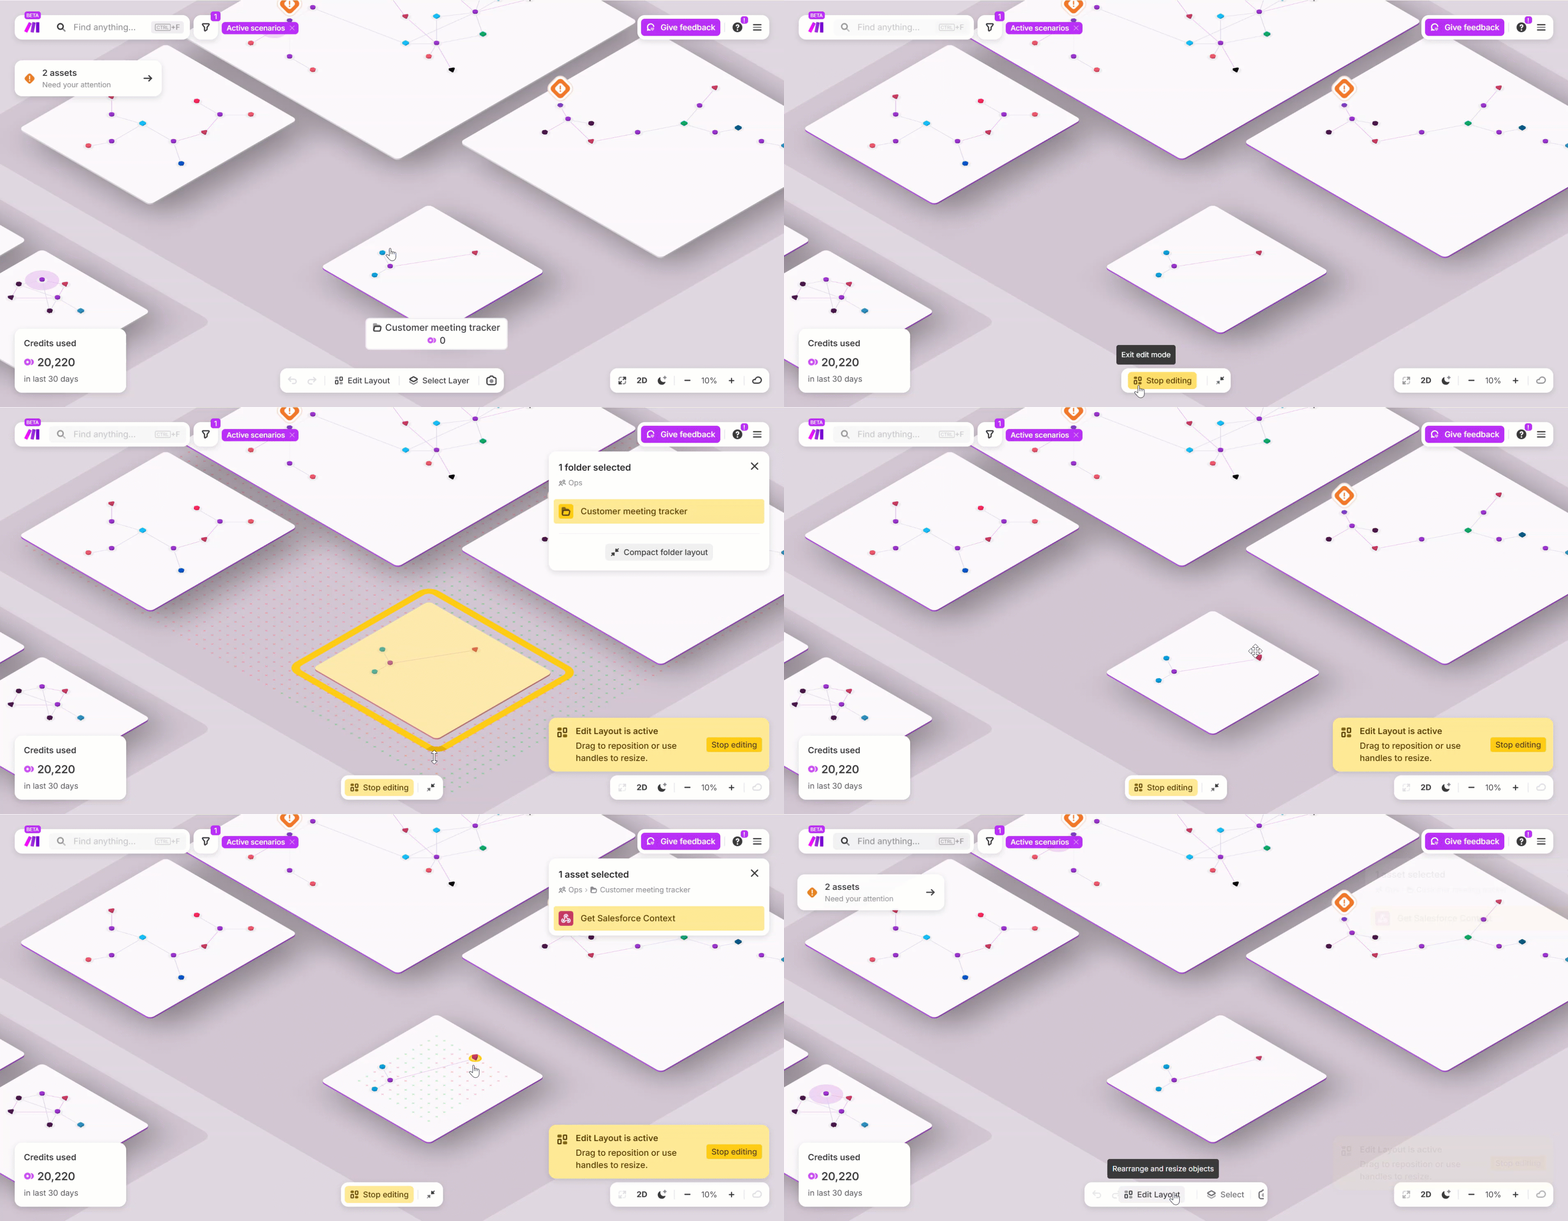
Use the Compact folder layout to rearrange assets and remove empty spaces. This action cannot be undone.
- Select Layer and Take snapshot
With the Select Layer feature, you can select between different views on your automation landscape, such as:
- Explore: Use this layer to view your core assets and the direct connections between them.
- Credits: Use this layer to view the credits used in the last 30 days for scenarios, folders, and teams.
- Data Transfer: Use this layer to view the data transferred in the last 30 days for scenarios, folders, and teams.
- Operations: Use this layer to view the operations completed in the last 30 days for scenarios, folders, and teams.
Use the What needs attention toggle to show or hide the Need your attention widget.
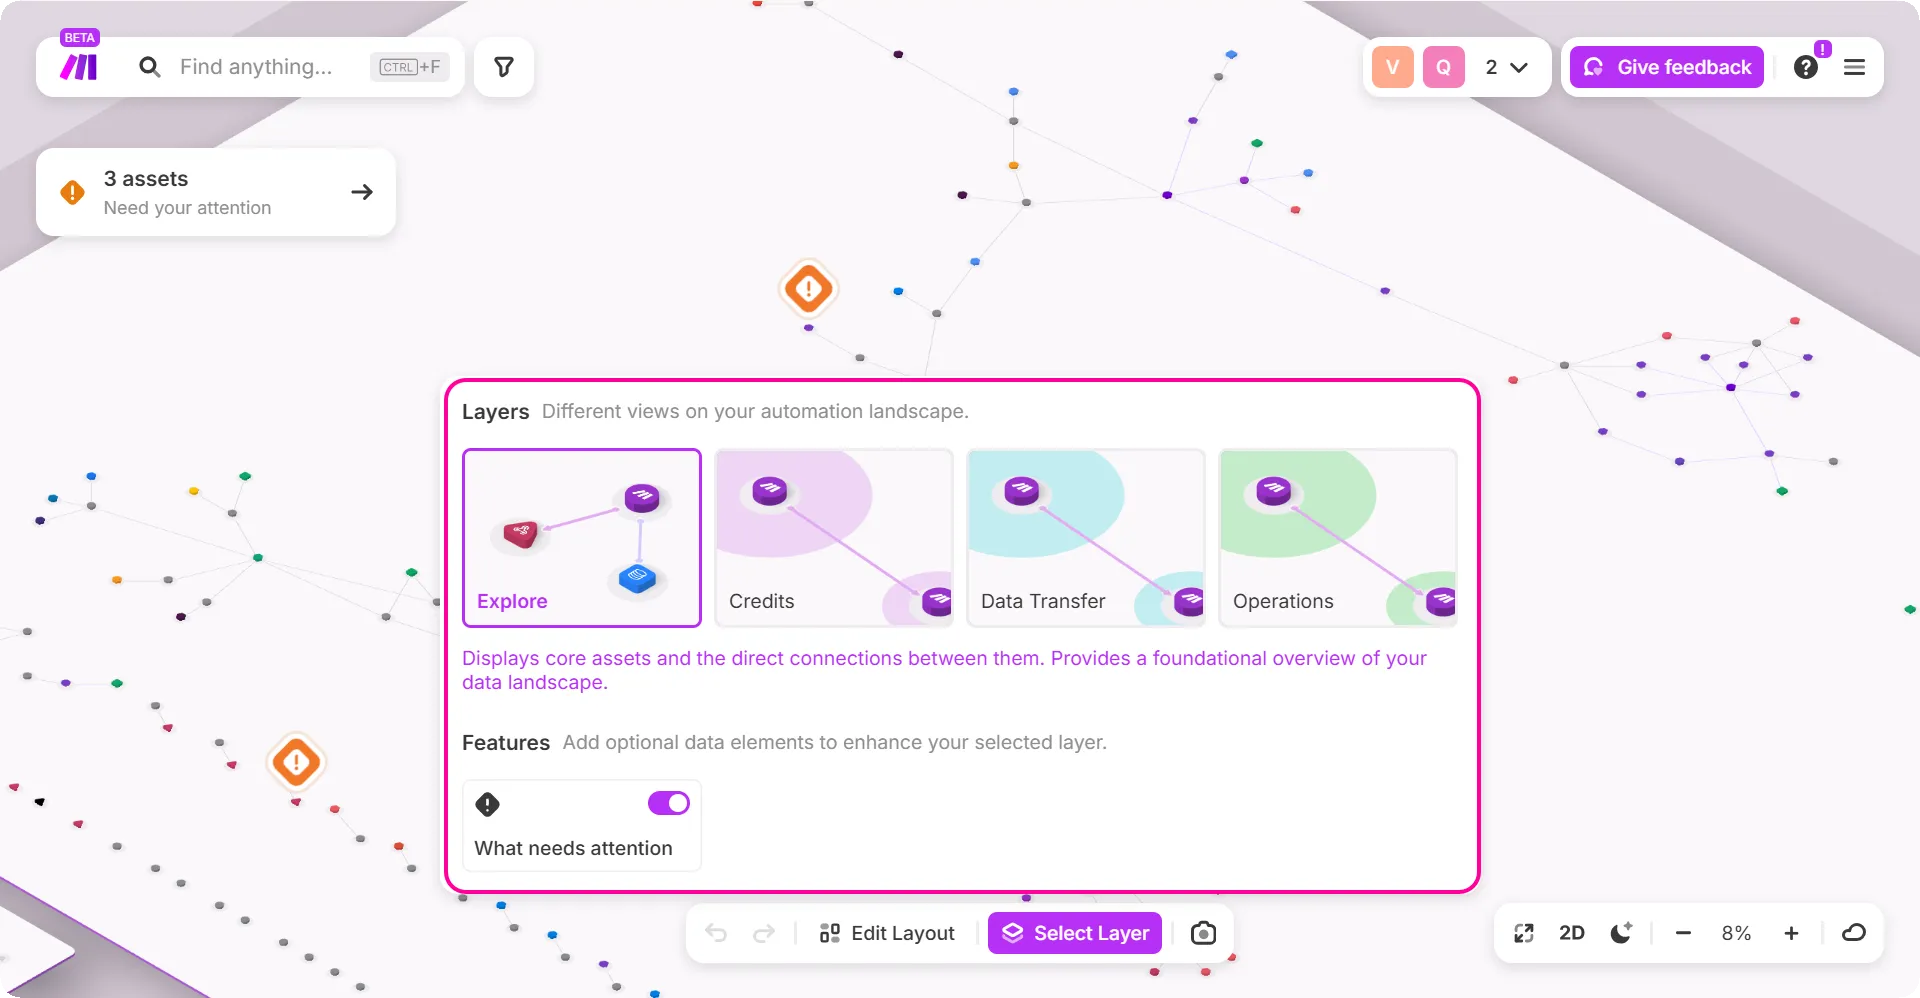
With the Take snapshot feature you can take snapshots of your grid. The image is saved in your downloads automatically.
- Team
A group of people working on a collection of related scenarios in Make. A team can also be called a collection of islands. You can work together with your team and see active teammates and their cursors in real-time.
- Usage status
This feature is only displayed when a layer is selected. It serves as a quick performance indicator, helping you monitor credits used, data transferred, and operations consumed in the last 30 days.
Make Grid elements
Use the following guide to interpret the specific elements that populate your Make Grid. These markers represent some of the core building blocks of your automation landscape:
Scenarios

This icon represents a Scenario. In Make, a scenario is a visual workflow that automates how data flows and actions are executed between connected applications and services.
Webhooks

This icon indicates the presence or configuration of a Webhook that facilitates event-driven integration with external services or applications. The color of the Webhook may vary depending on the application it is connected to.
Assets

This stacked square icon represents an Asset. The icon may vary depending on the type of asset you select. It represents a data storage element such as Google Sheets, Airtable, or a database.
Generic objects

This hexagonal icon represents a generic object. It can refer to items such as lists, AI assistants, mailboxes, channels, forms, or services. In Make Grid, only a limited set of applications is displayed explicitly; all other applications are grouped under services.
Agent
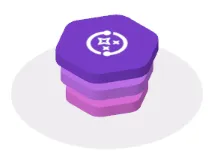
This icon represents the presence of an AI Agent.
Shared assets

Shared asset indicates that the module is shared across folders or used in multiple scenarios.
Links and arrows
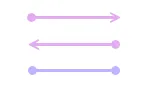
Purple links with an arrow are trigger links, they explain how one module triggers another. The violet links are data links that show how a module interacts with data from another module.