How to use Make Grid
Make Grid helps you understand and manage your automation ecosystem. Here are the most common ways to work with Make Grid based on what you're trying to accomplish.
Search scenarios by content
Make Grid's search bar doesn't just match scenario names or apps, it also searches inside scenario blueprints.
What you can do:
You can find scenarios based on what's configured inside them, including module field values, scenario notes, and AI Agent system prompts. This is useful when you need to track down where a specific value is being used across your automation ecosystem, without opening scenarios one by one.
Example:
A team member left notes in a scenario explaining a workaround. You remember a word from the note but not the scenario name. You can search that word to find it instantly.
Open your dependencies from Make Grid
Your automation landscape is not just something you can view, it is a fully interactive environment where you can manage your dependencies.
What you can do:
You can open, review, and edit connected objects directly from Make Grid canvas without needing to jump between tabs.
View and edit: View and edit Google Sheets, Docs, Slides, Calendar, and JotForm directly within Make Grid to make live changes.
View only: Preview Google Forms, Tally, and Typeform to verify configurations.
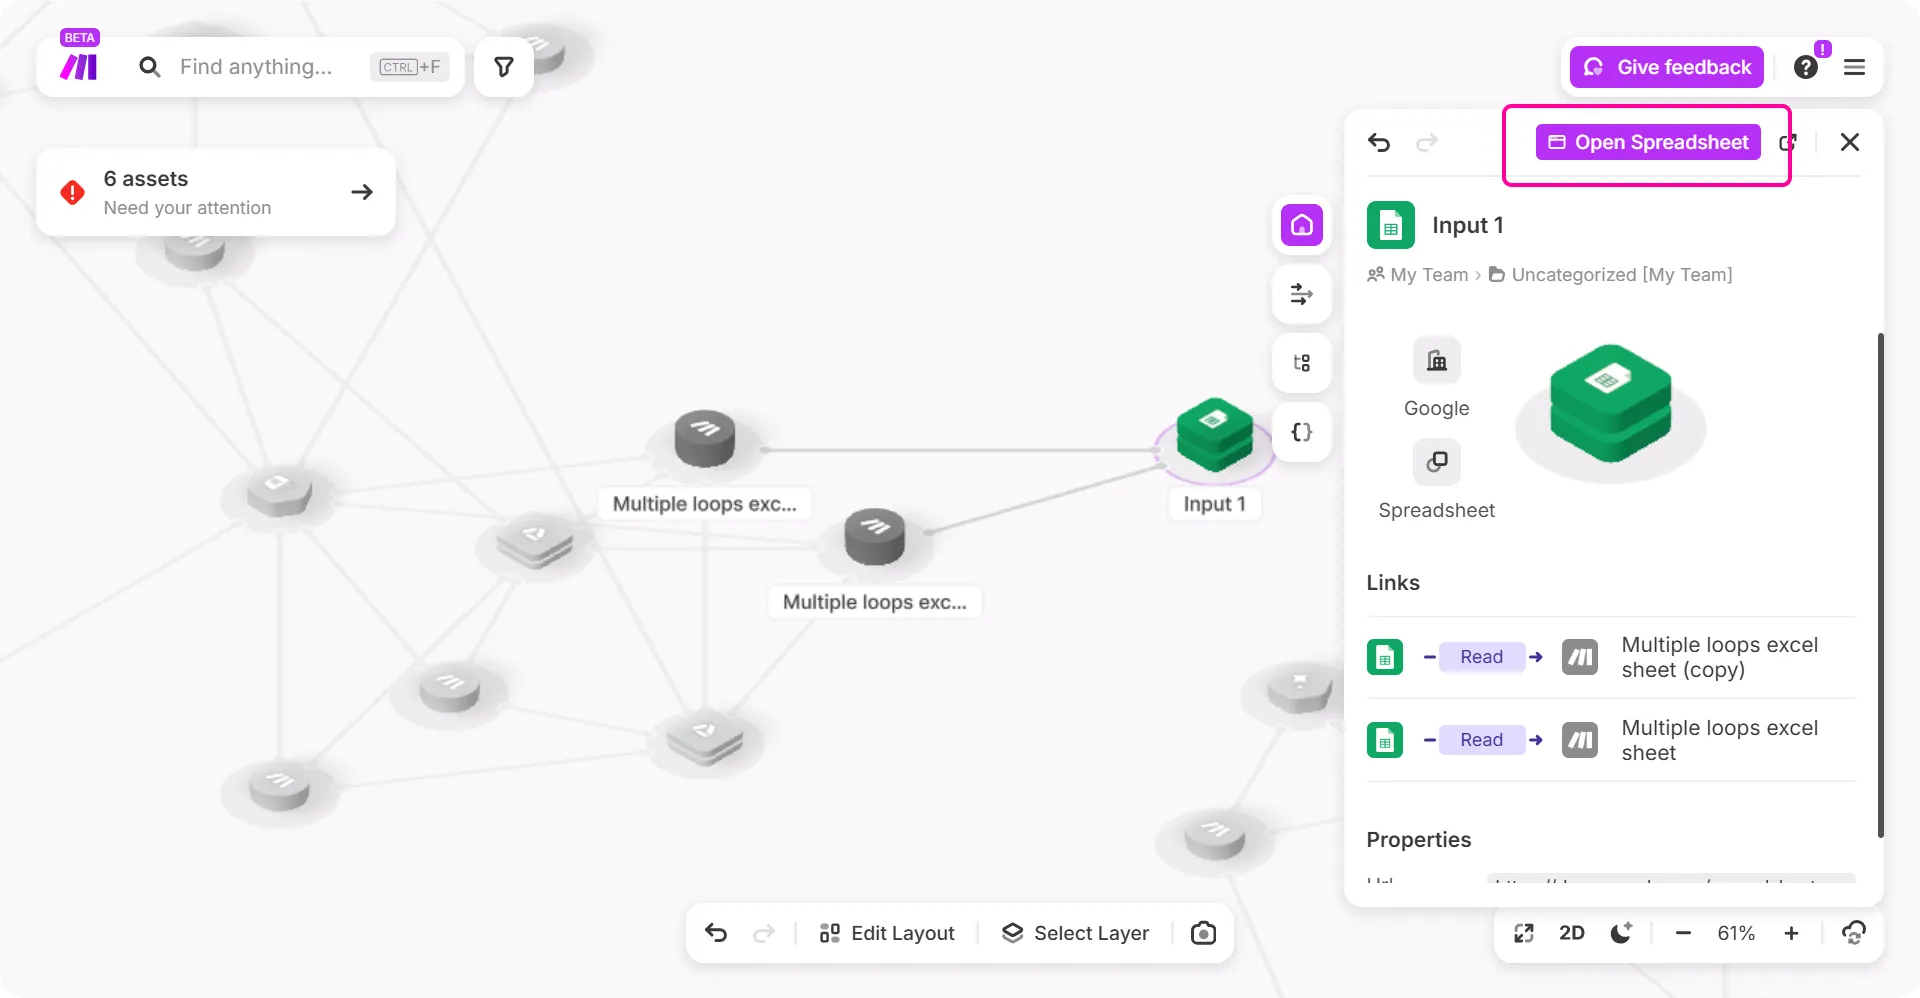
Example: You are reviewing a complex automation and spot a Google Sheet that needs a quick data correction before your automation goes live. Instead of searching through your Drive or browser history, you simply open the Google Sheet from Make Grid, update the cell, and save it. You cav perform a cross-platform update without ever leaving your automation map.
View and understand your dependencies
When you're managing multiple scenarios, it's easy to lose track of how everything is connected. Make Grid shows exactly which scenarios rely on each dependency.
What you can do:
Click any dependency, such as an Airtable table, to see which scenarios rely on it. Hover on the specific links to open the scenario directly. You can also search for any entity such as a table, an URL, or app to instantly see what depends on it.
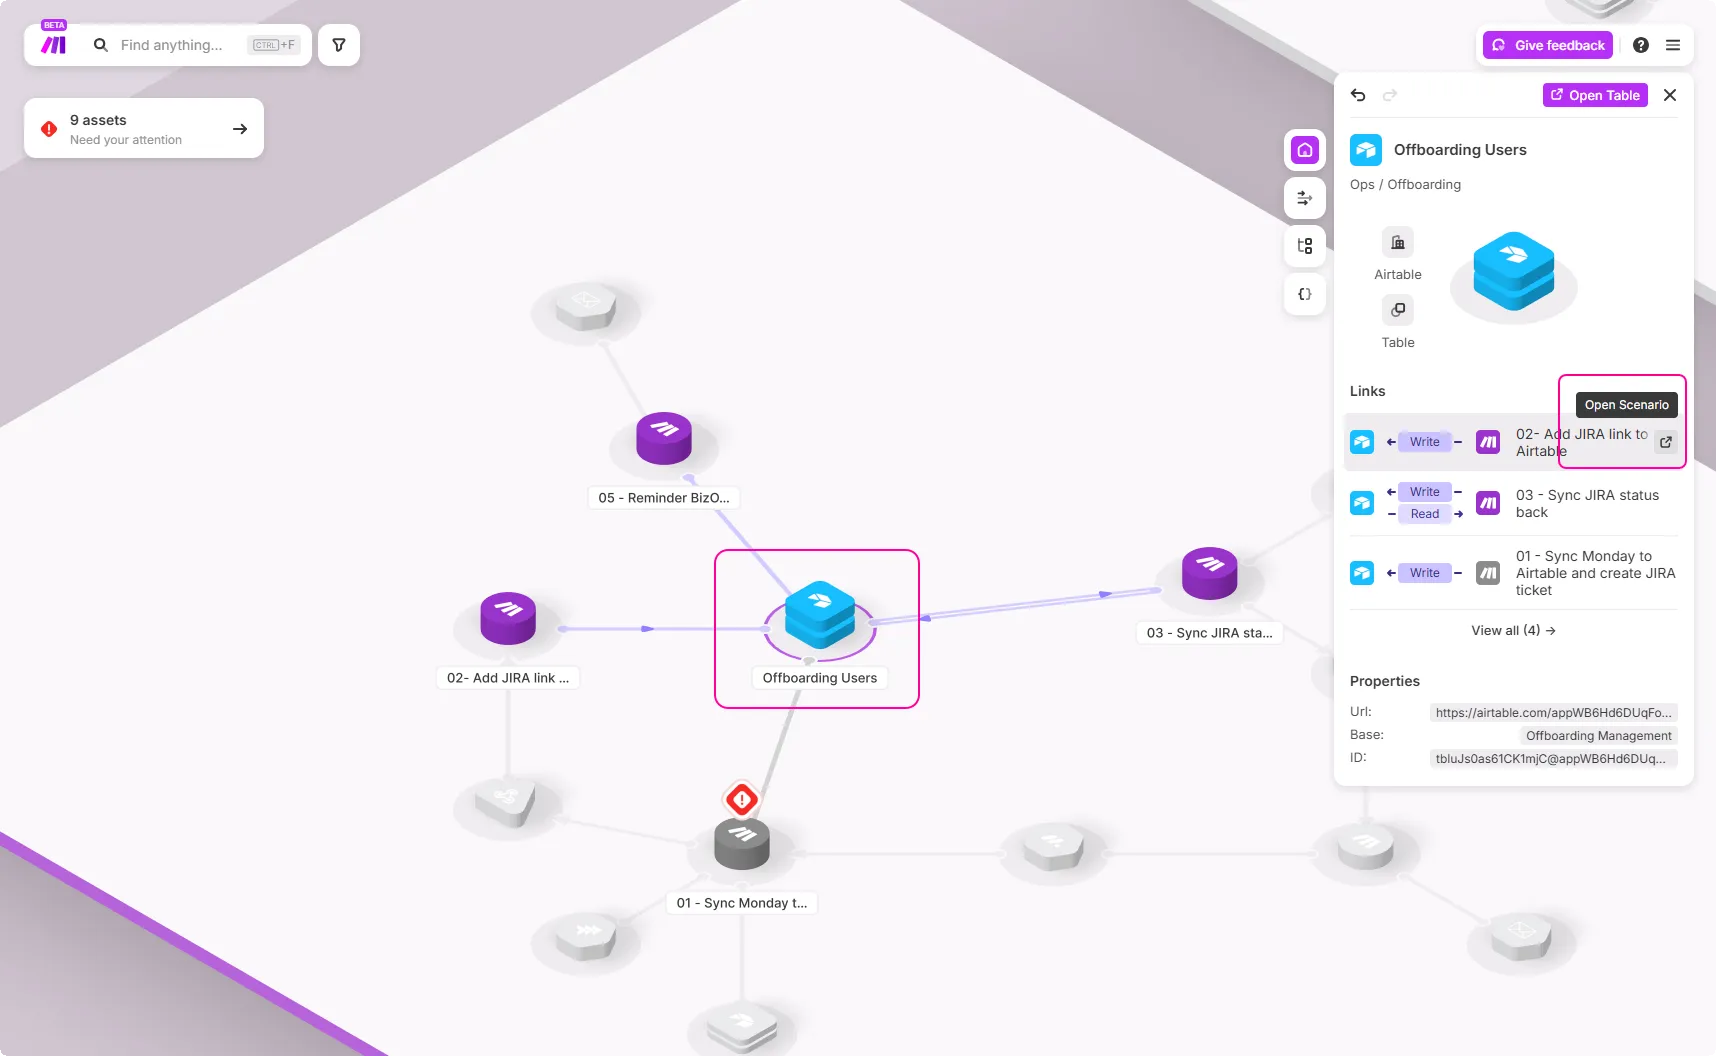
Example: Your team uses a shared "Offboading Users" table in Airtable across multiple scenarios. You search for it in Make Grid and immediately see it's used by four scenarios. Now when someone asks "Can we change this table structure?" you have a complete picture of the impact.
Trace your data flows
Make Grid helps showcase data flow of the automation you've built using Make. When you click on a dependency, you can view which scenarios read or write to that dependency.
What you can do:
Click on any dependency to see which scenarios interact with it. View which scenarios read from or write to that dependency and understand the chain of actions.
Example:
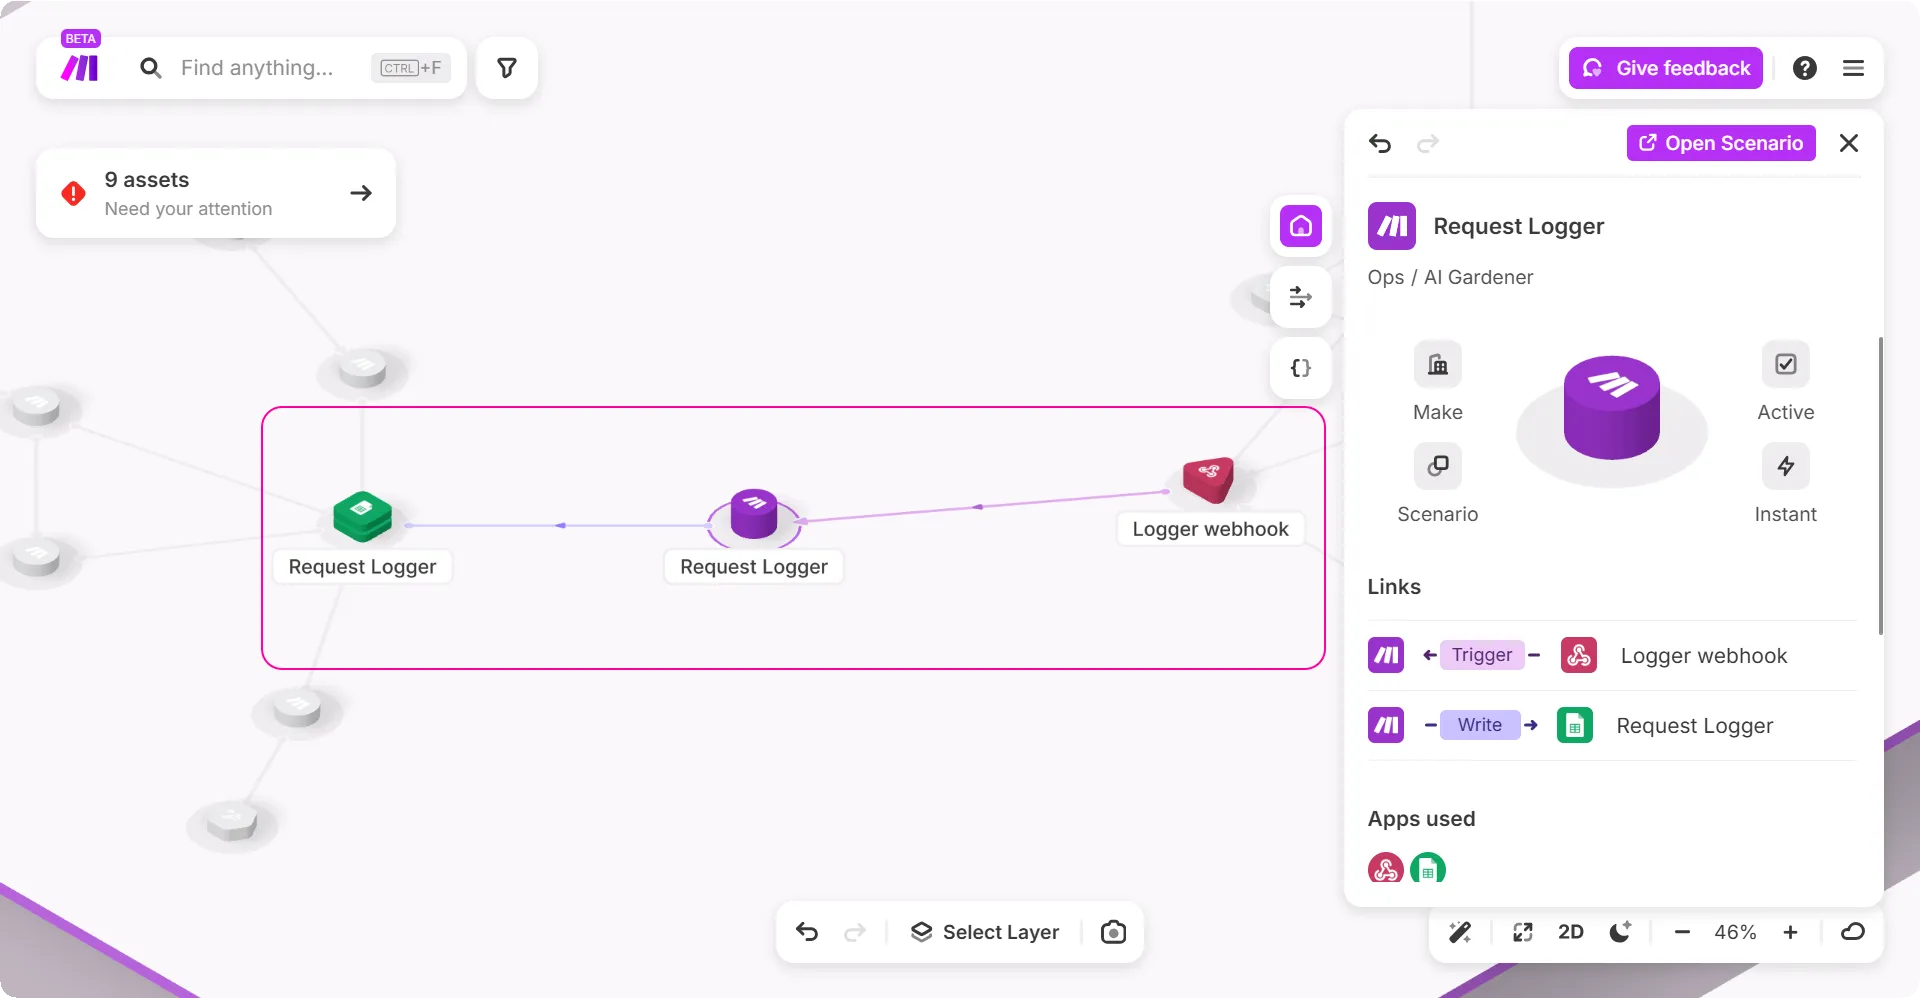
In the example below, you can see that the Request Logger scenario is triggered by a webhook and it writes to a dependency, which is Google Sheets. So when a colleague asks where does the Request Logger scenario gets its data from, you open Make Grid to explain the flow.
Click on the Request Logger scenario to trace the flow: webhook triggers Request Logger → Request Logger writes to Google Sheets → data is now available for you. Due to this data flow, you can see the chain of actions within your solution.
Find errors in your scenarios
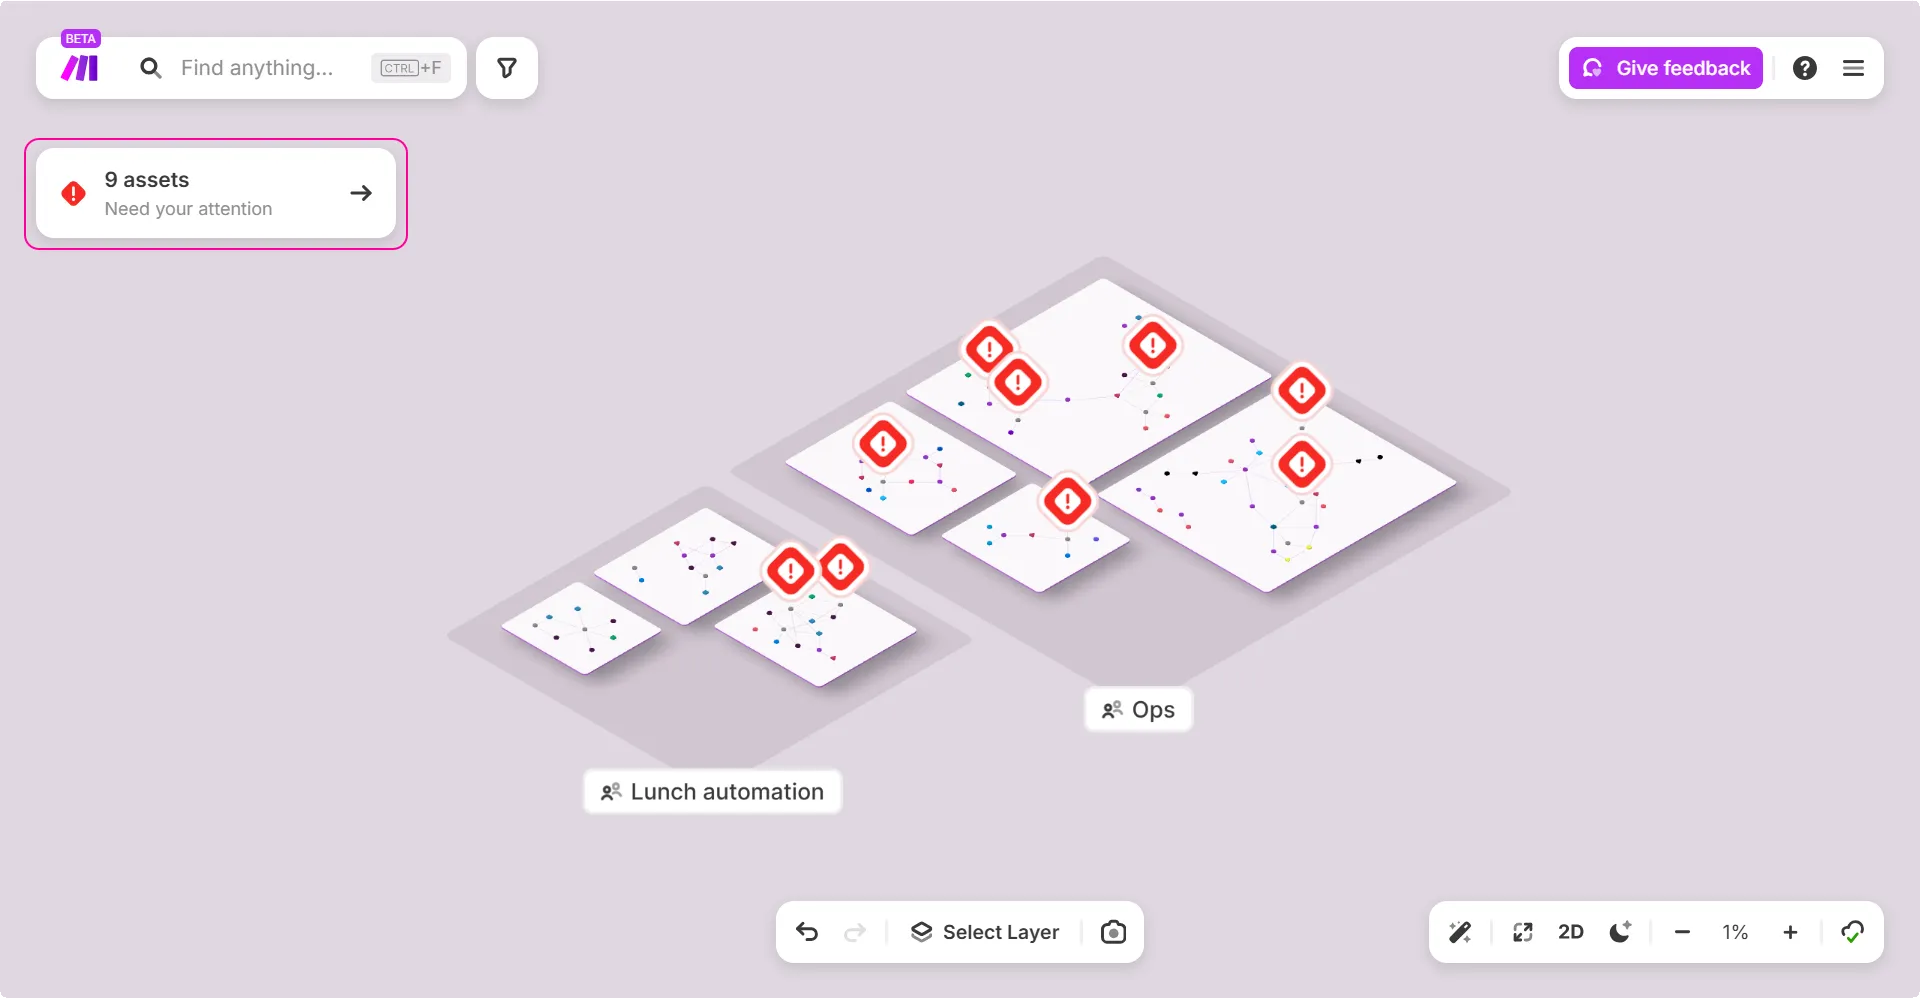
The red flags shown in the image are an indication that your scenarios have errors and need your attention.
What you can do:
You can either click on individual red flags or click the Need your attention widget and view all scenarios with errors at once. This allows you to quickly identify which scenarios are impacted and prioritize your investigation.
Example:
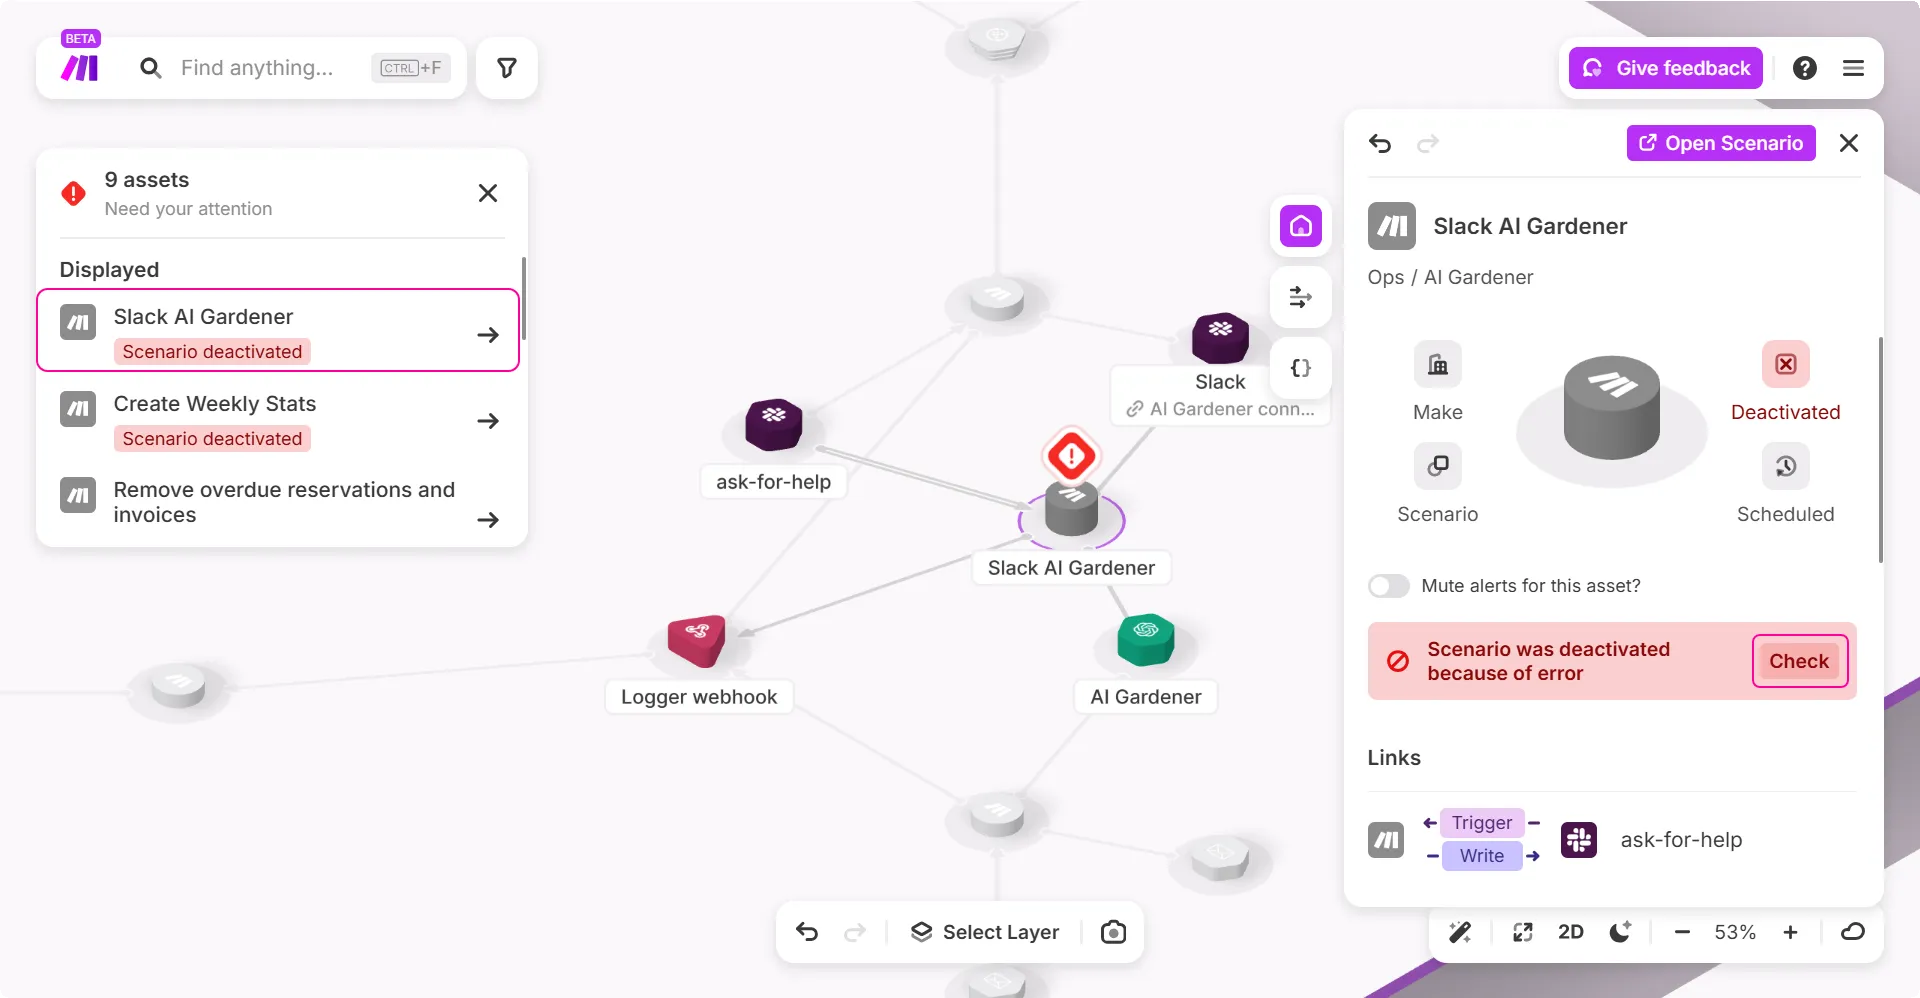
In the example below, click the Slack AI Gardener scenario error for analysis. Click Check to view the scenario’s history log and investigate further. These errors are not only displayed in scenarios but can also alert you to issues with dependencies, such as capacity problems in data stores or queue backlogs in webhooks.
View your credit consumption
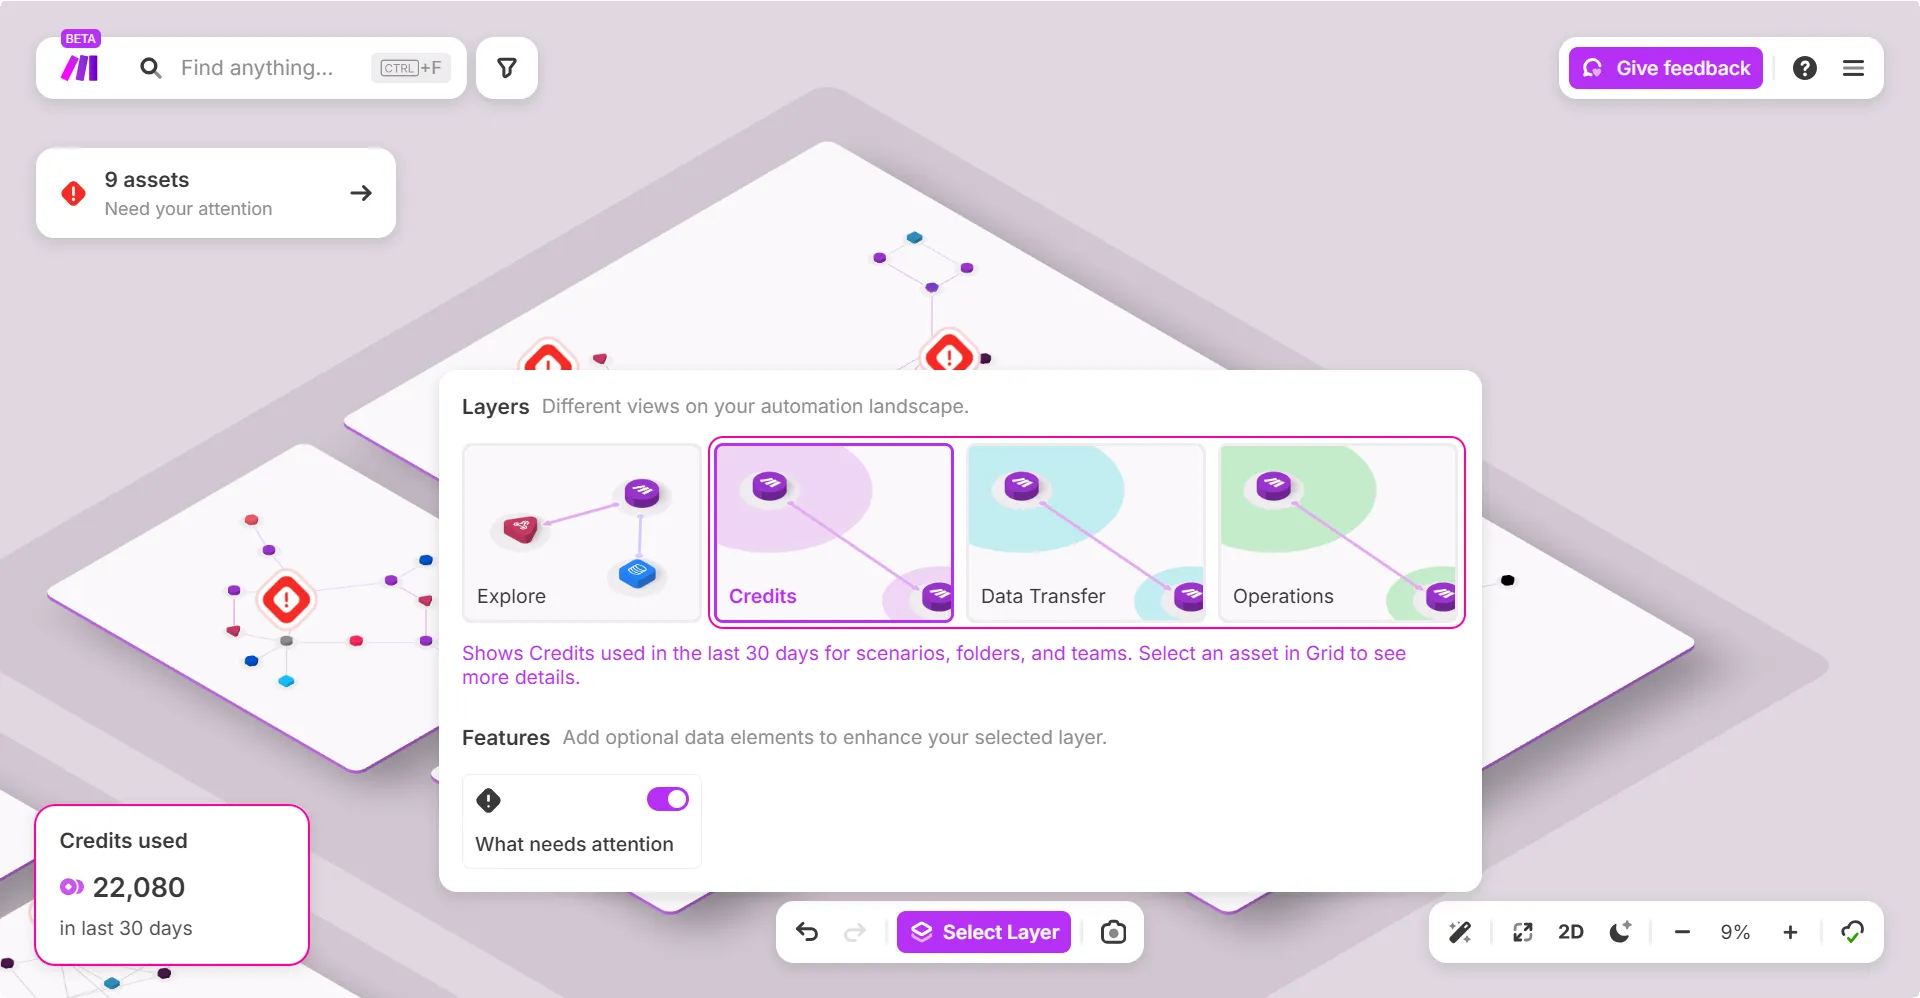
Make Grid helps you understand how credits are consumed across your automations. By using the Select Layer feature, you can visualize credit usage, data transfer, and operations consumed over the last 30 days. This helps identify scenarios that may need optimization.
What you can do:
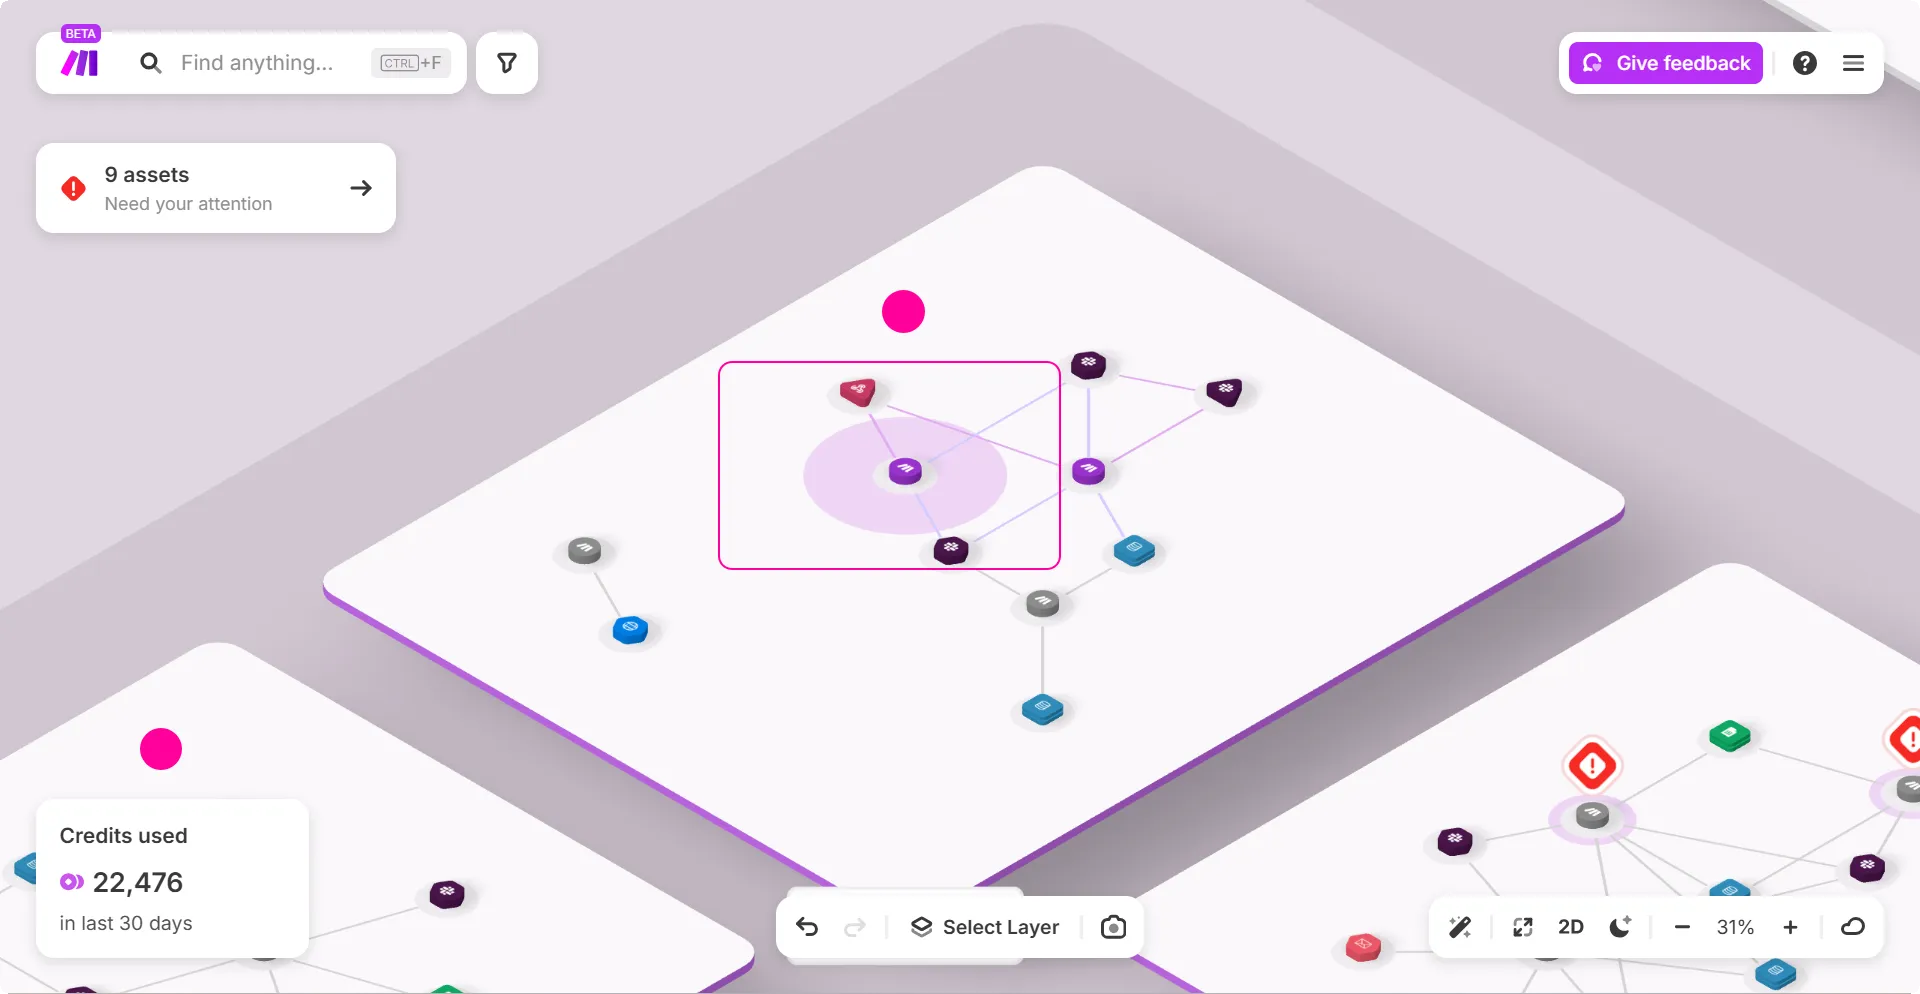
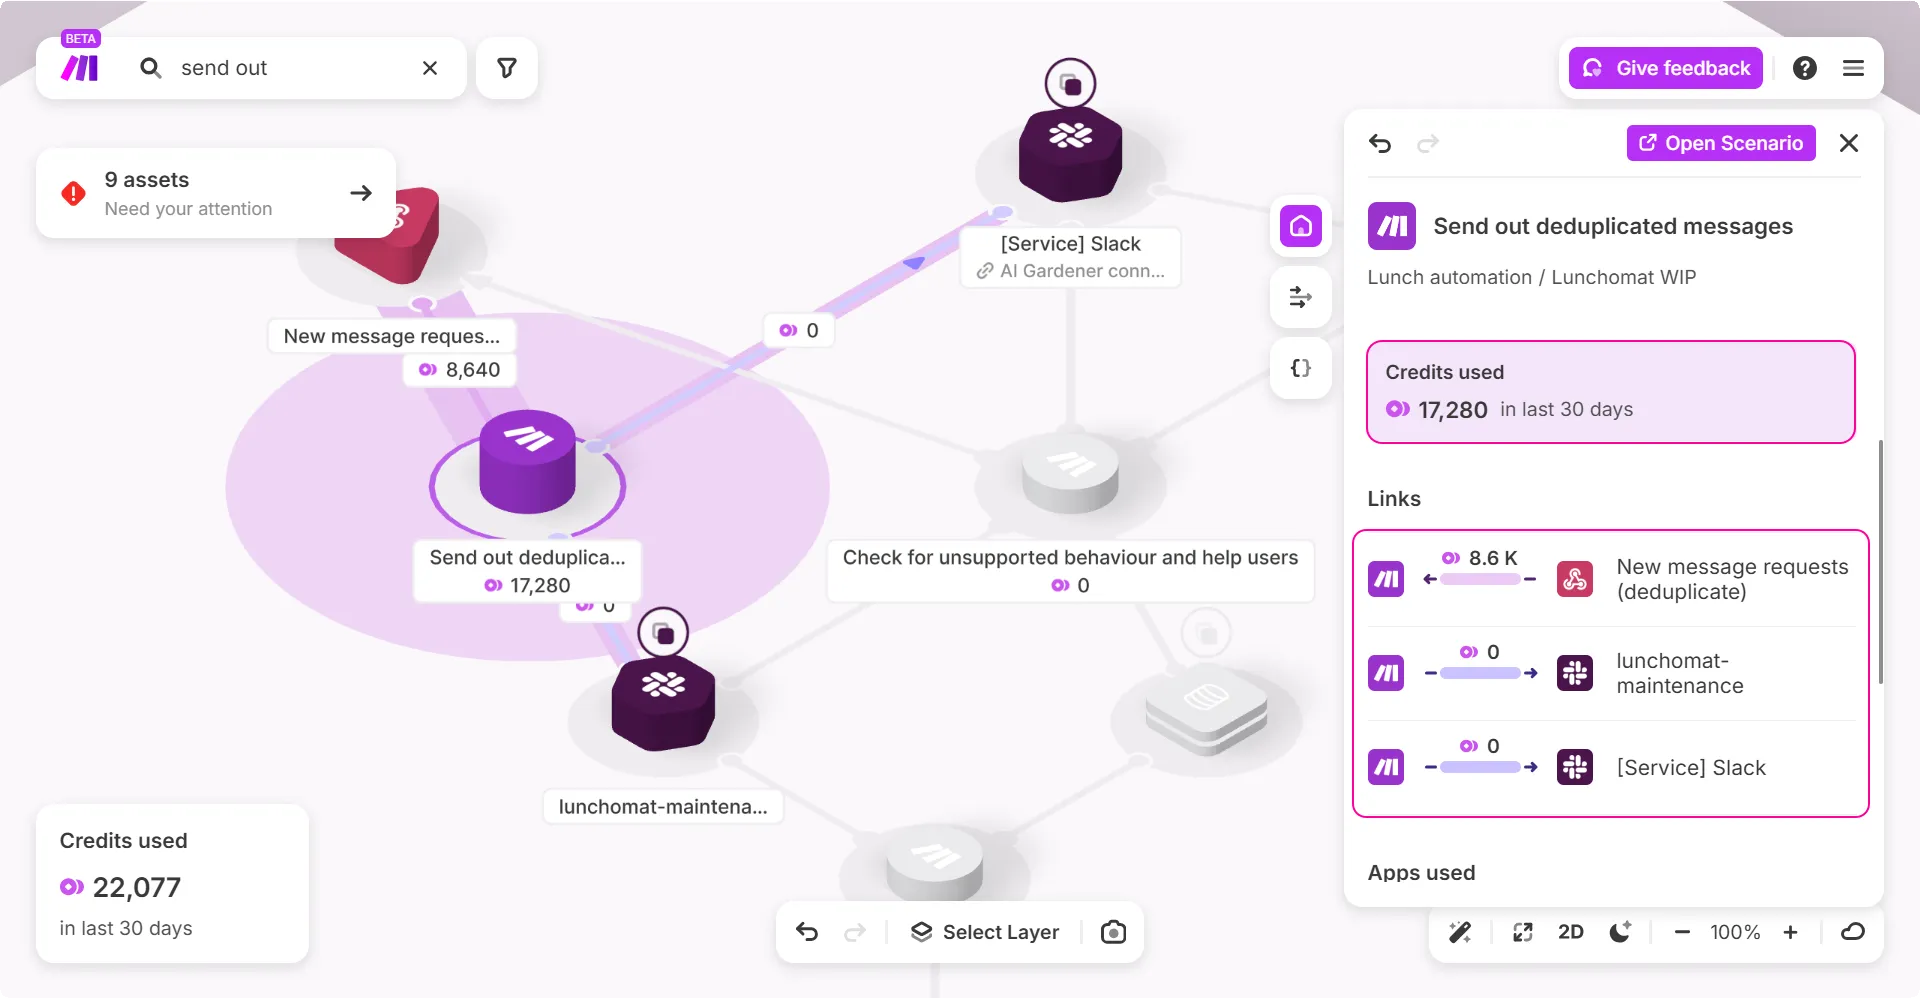
Click on the Credits layer and zoom in on a scenario to view its credit usage. Each scenario is represented by a circle, where the size of the circle indicates the amount of credits consumed - the larger the circle, the higher the credit usage.
Example:
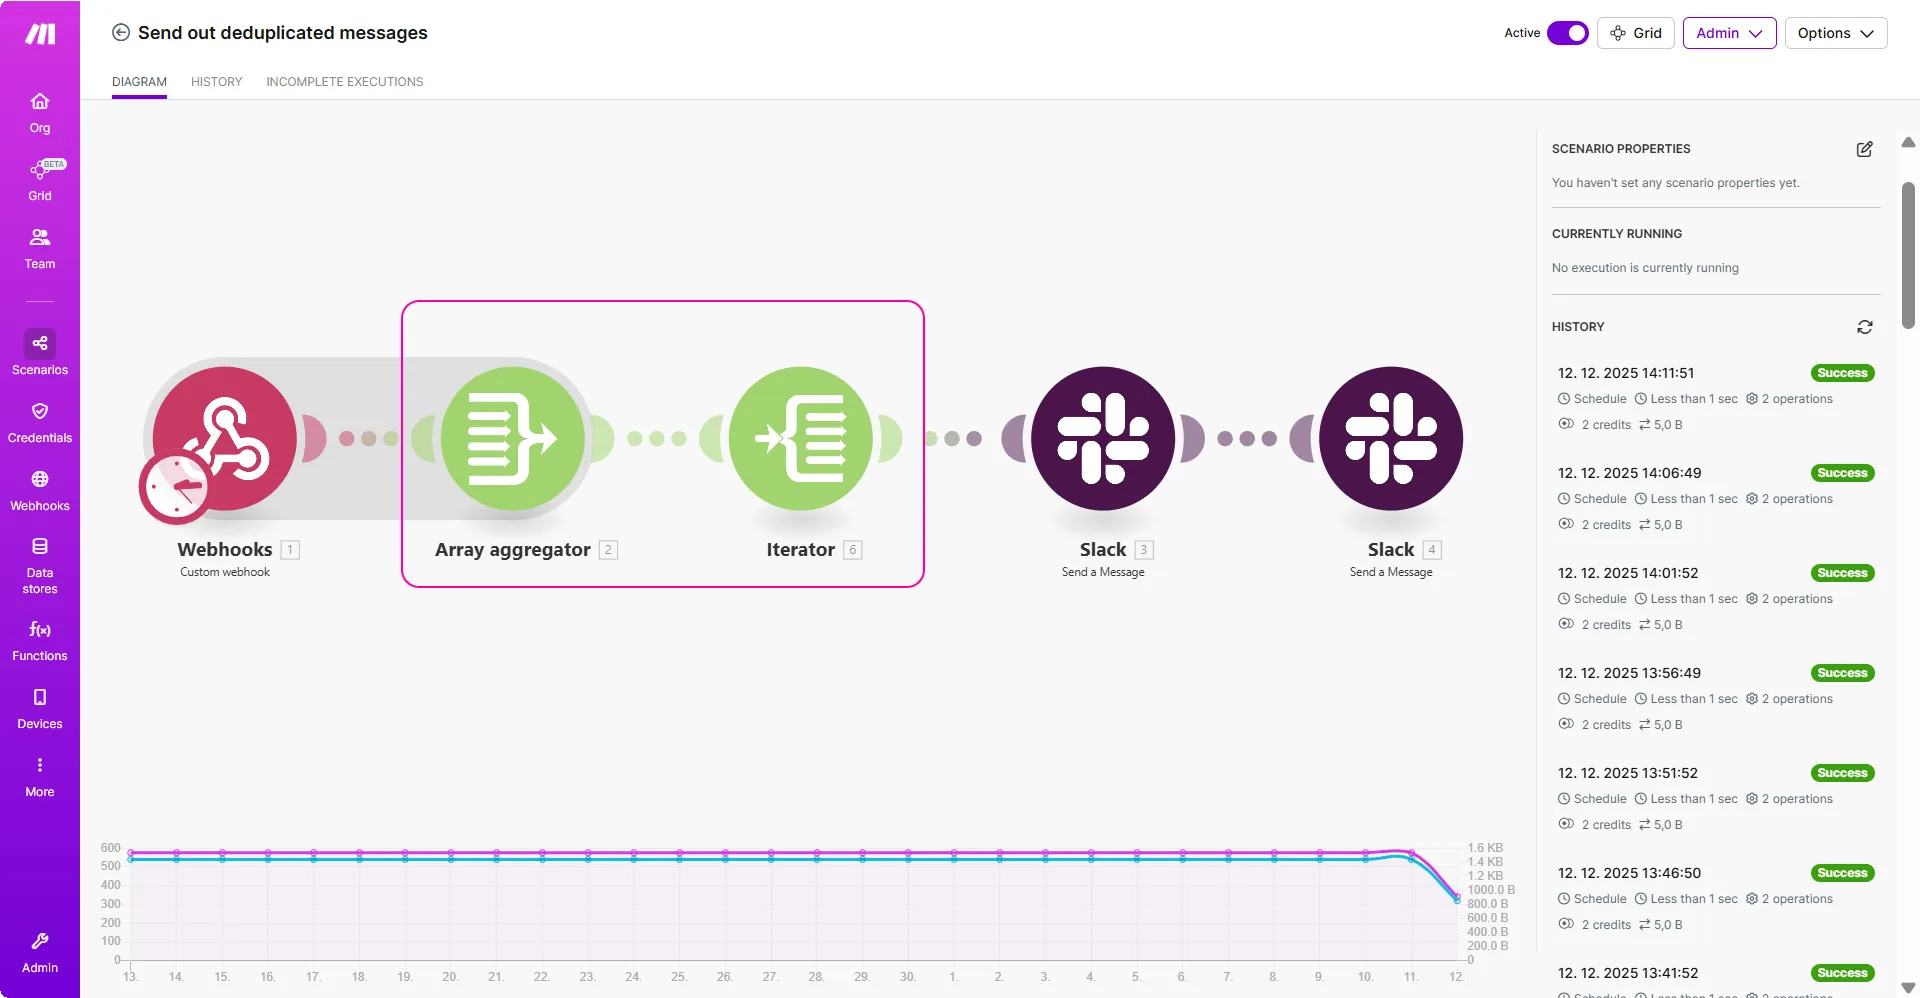
In some cases, you may see higher consumption than what is displayed in your mapped scenario. In the below example, the scenario shows a total consumption of 17,280 credits. However, reviewing the credits consumed by its dependencies, the total is 8,640+0+0=8640. This discrepancy occurs because Make Grid does not display the credit consumption by data transformers such as iterators, aggregators, and similar components.
When you open the scenario, you can see it includes an Array aggregator and an Iterator, which together account for the rest of the credits.
Deprecate a column in your database
Make Grid helps you safely deprecate part of a data element, such as a column in a database, by showing where it is used across your automations. This visibility helps prevent breaking scenarios when making changes.
What you can do:
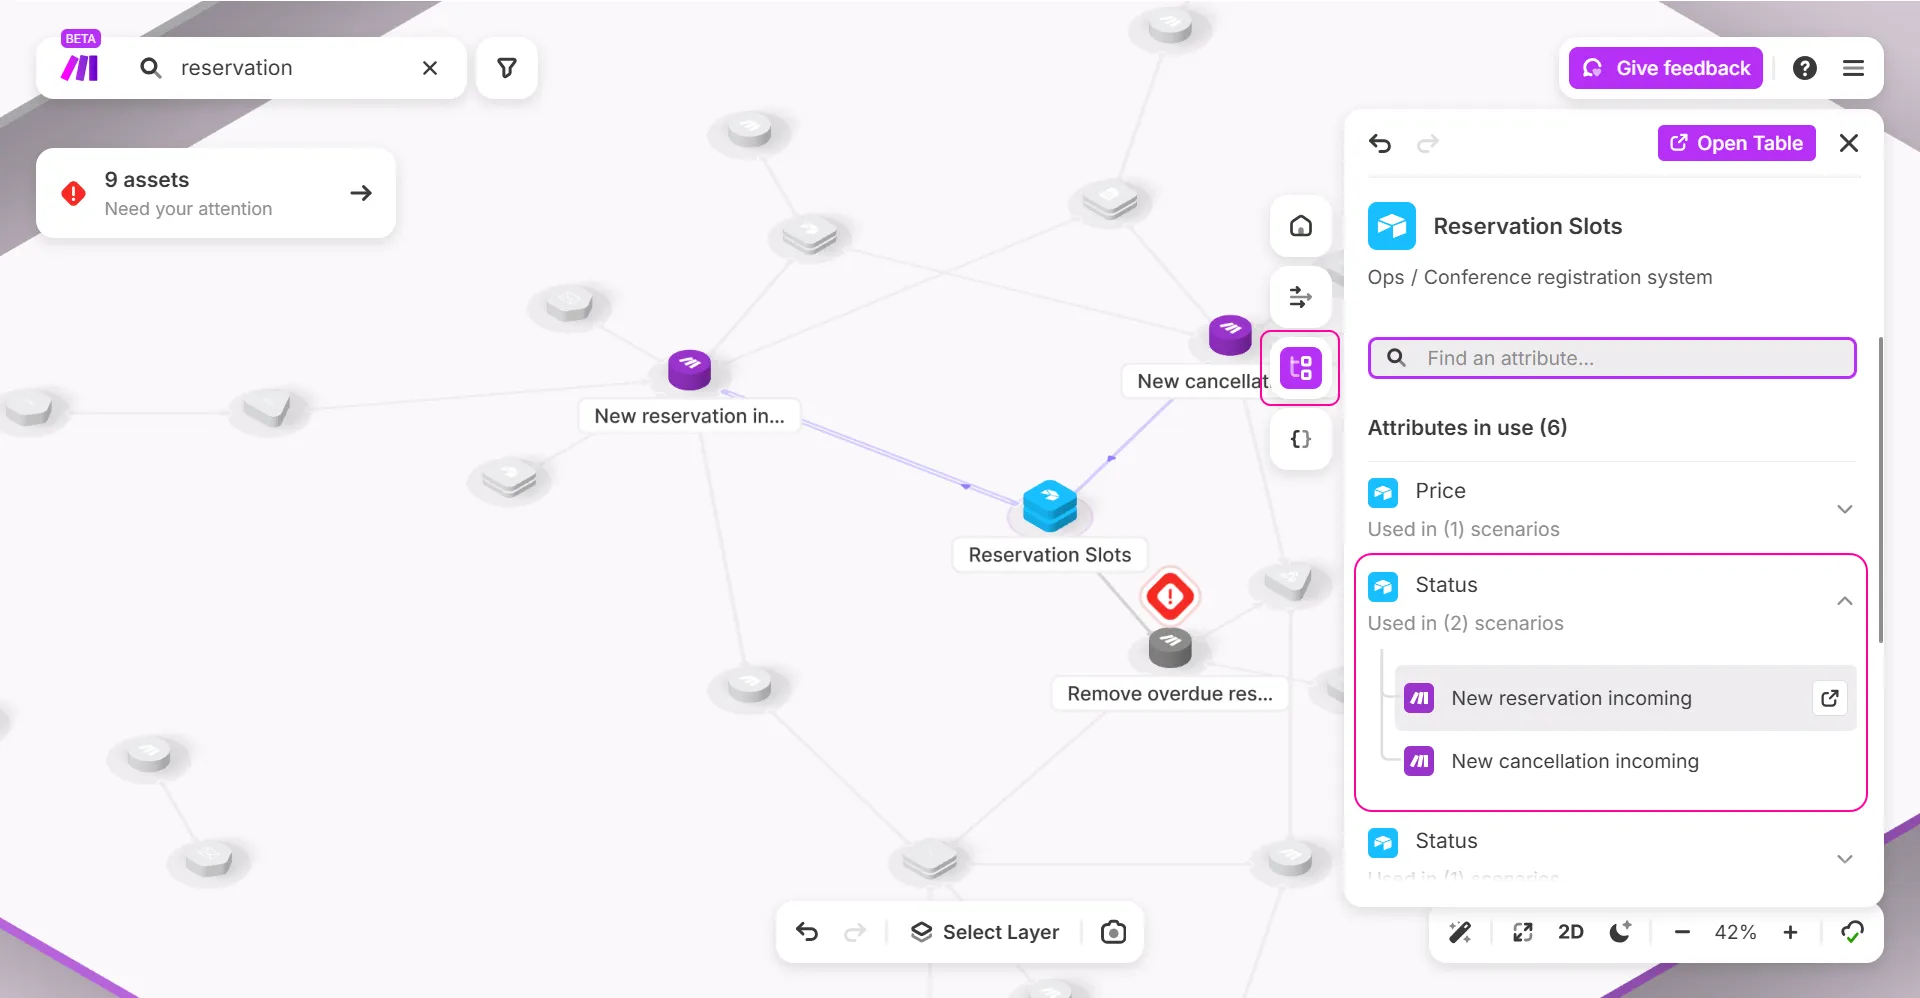
Select the dependency and click Attributes in the side panel to view all scenarios mapped to a specific column. You can see which scenarios reference that attribute and assess the impact before making changes.
Example:
In the example below, you want to deprecate a column in an Airtable called Status. Make Grid gives you an option to view the dependencies that map to this attribute. You can click Attributes in the side panel and see that this column is used in two scenarios. You can then open the scenario by clicking the Open Scenario pop-out button and edit the dependency in the scenario editor.
Identify the endpoints of your HTTP modules
Make Grid helps you quickly identify the service endpoints used by your HTTP apps.
What you can do:
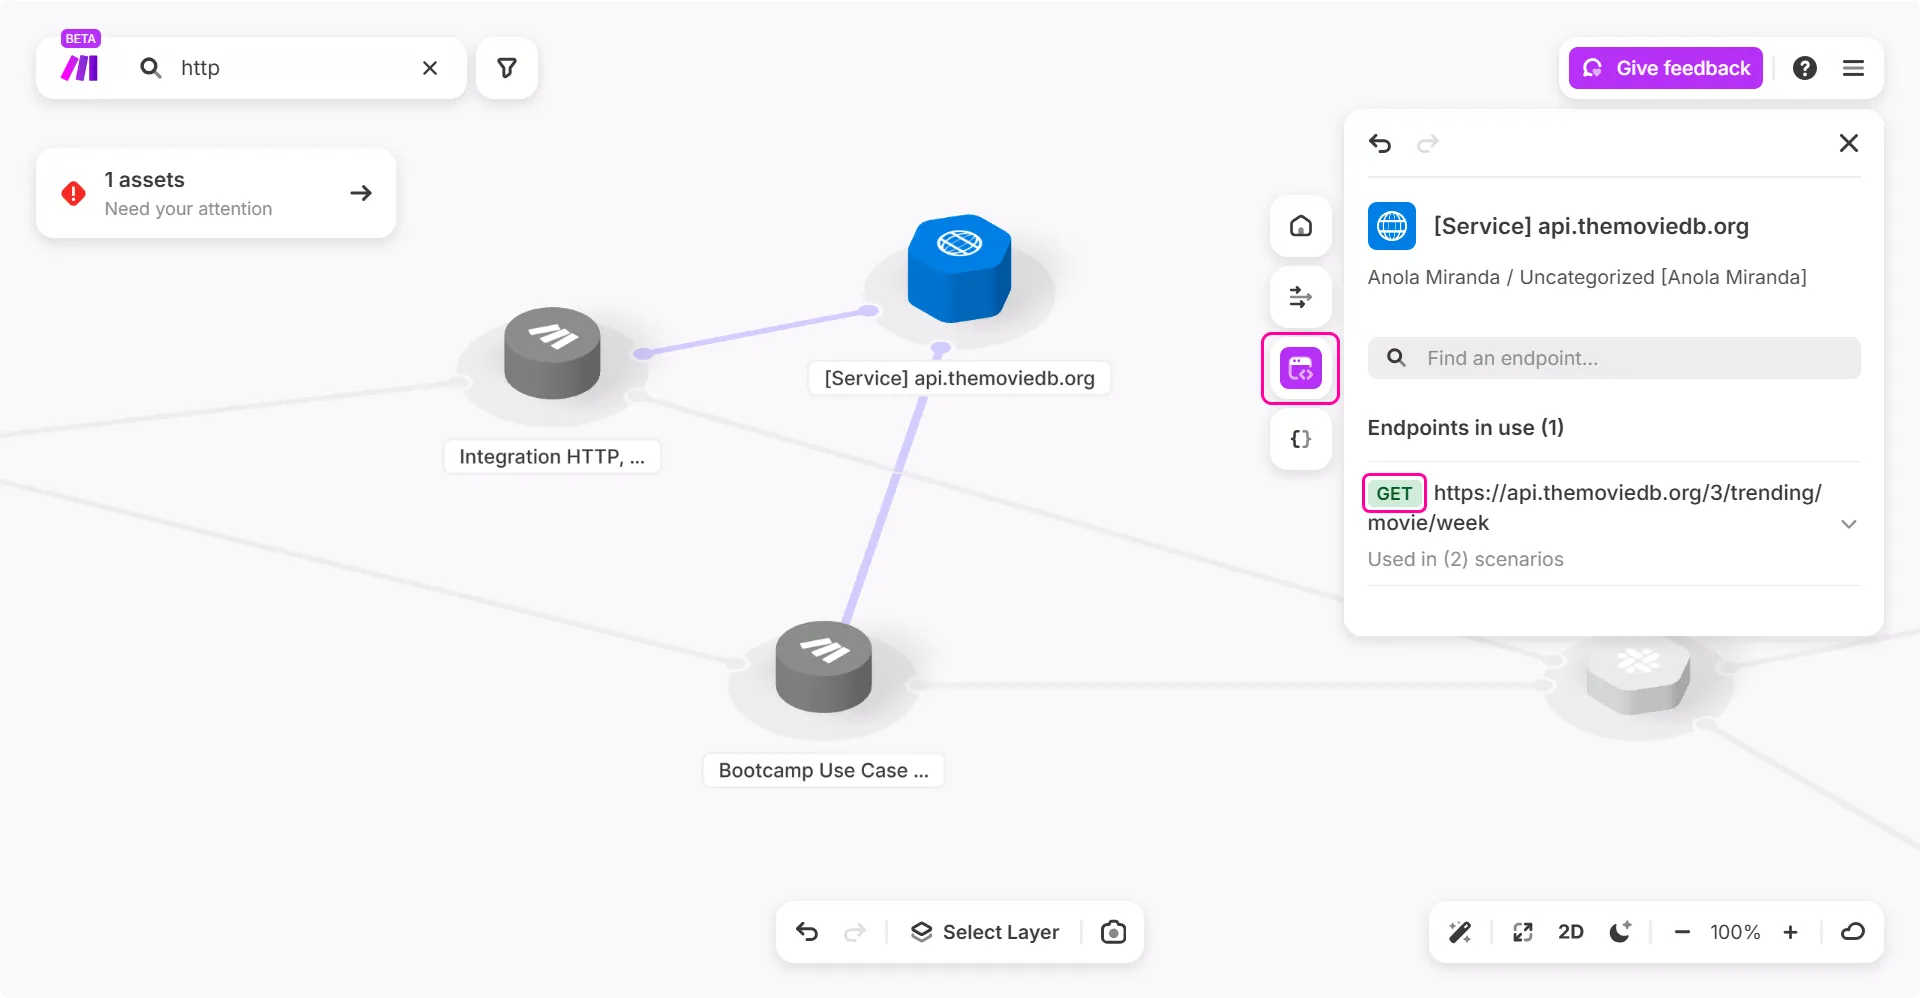
Select an HTTP app in the grid and open the Endpoint tab in the right-side panel. This shows the service associated with the endpoint.
Example:
In the example below, selecting an HTTPapp and opening the Endpoint tab displays the service endpoint it connects to. This makes it easy to understand which external service the app communicates with and helps when reviewing, troubleshooting, or documenting your integrations.
View your active scenarios
Make Grid helps you manage large workspaces by providing a clear view of your automations. But as the number of scenarios grows, the grid can become crowded, making it harder to navigate and analyze dependencies.
What you can do:
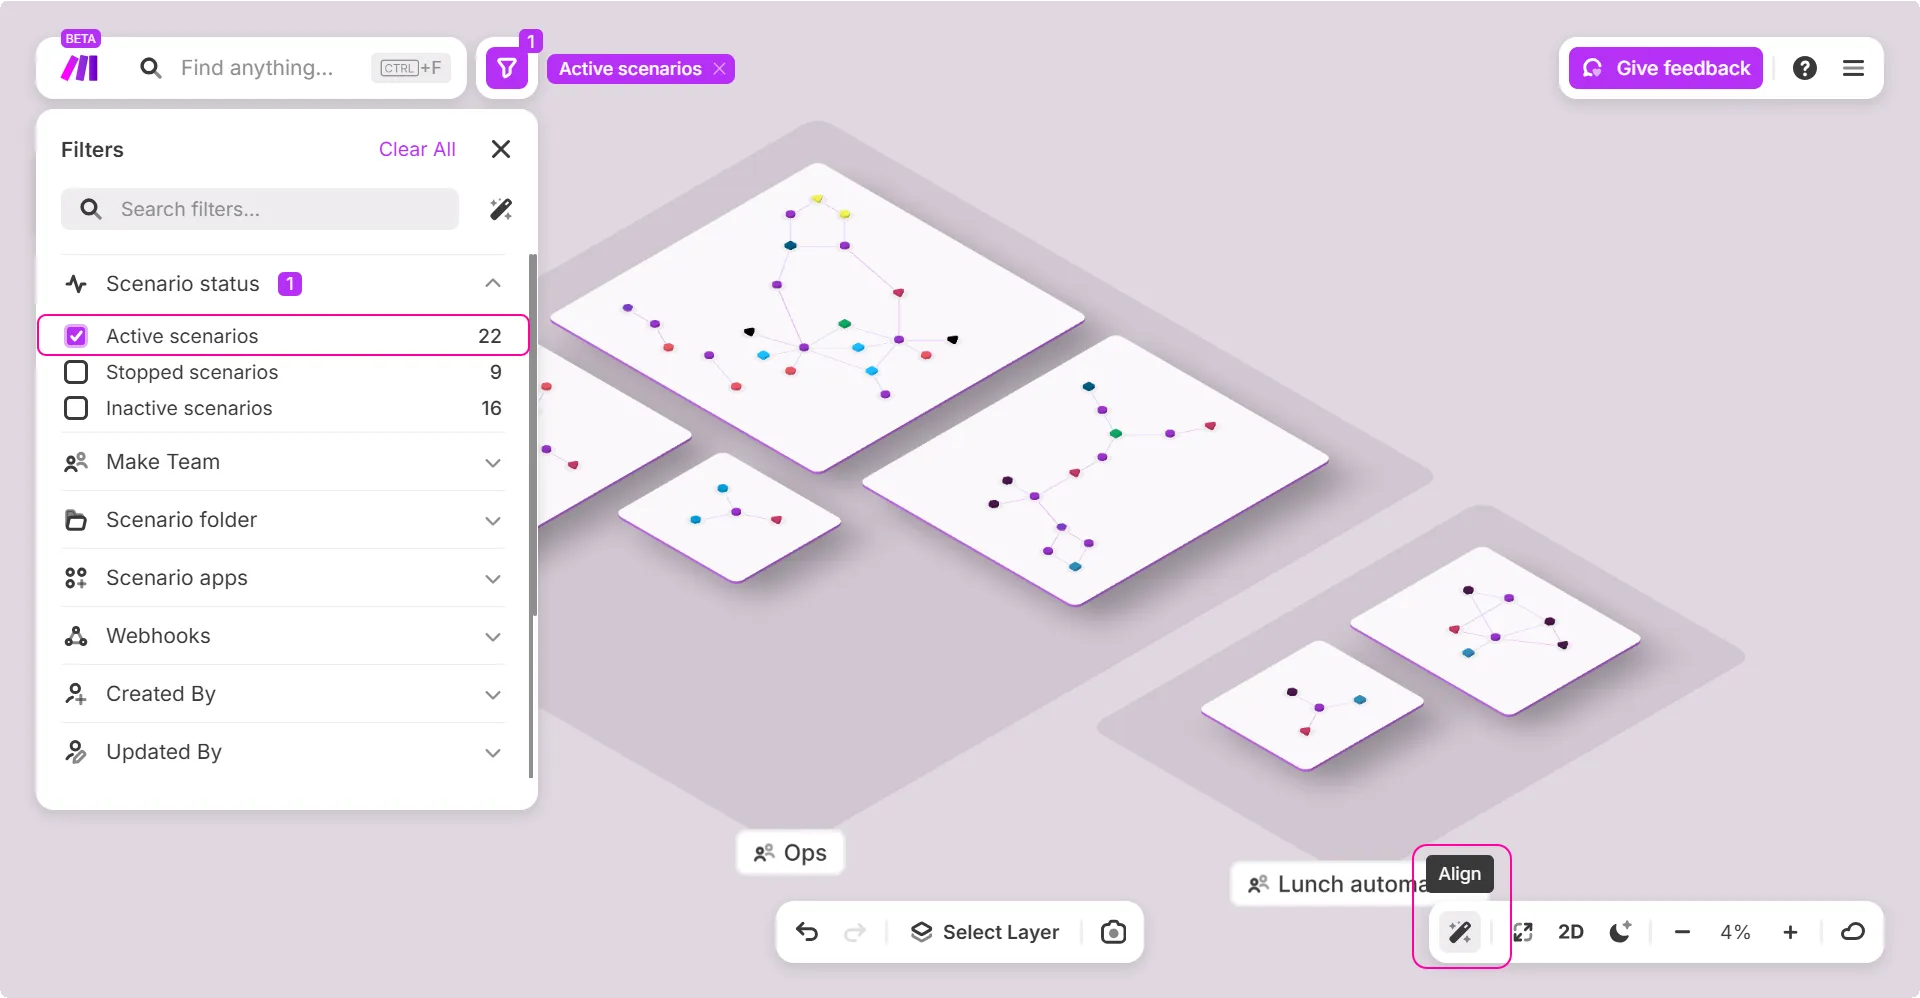
In Make Grid, you can use the Filters panel to narrow down the displayed scenarios. For example, select Active scenarios to hide inactive ones and focus only on the scenarios that are currently running.
Example:
In the example below, applying the Active scenarios filter removes all inactive scenarios from the grid. Once filtered, you can use the Align tool to automatically arrange all elements, creating a cleaner and more organized layout.