Parallel Capacity
Your organization can run a limited number of scenario runs at the same time. This page explains how that capacity works, how to monitor it on the Parallel capacity dashboard, what happens when you reach your limit, and how to reduce peak load.
Parallel capacity is about how many runs happen at the same time and how many resources they consume. It's not about how many runs you make in total, how many credits they use, or how long they take.
How parallel capacity works
Every scenario run takes capacity while it's running, and releases it as soon as it finishes. Think of it like parking spaces. Your organization has a fixed number of spaces, and a car has to leave before another one can park.
Capacity is measured in Processing Units (PUs). A typical run takes one PU. Runs that process large amounts of data use more memory, and those runs take more than one PU for the whole time they run. Two scenarios that run the same number of times can use different amounts of your capacity.
Your limit applies at the organization level, so all teams and all scenarios in the organization share the same pool.
Find the Parallel capacity dashboard
Go to Organization settings, open Dashboard, and select Parallel capacity.
The dashboard shows the processing units your scenario runs use over time, so you can view when you hit peak load and which scenarios drive it.
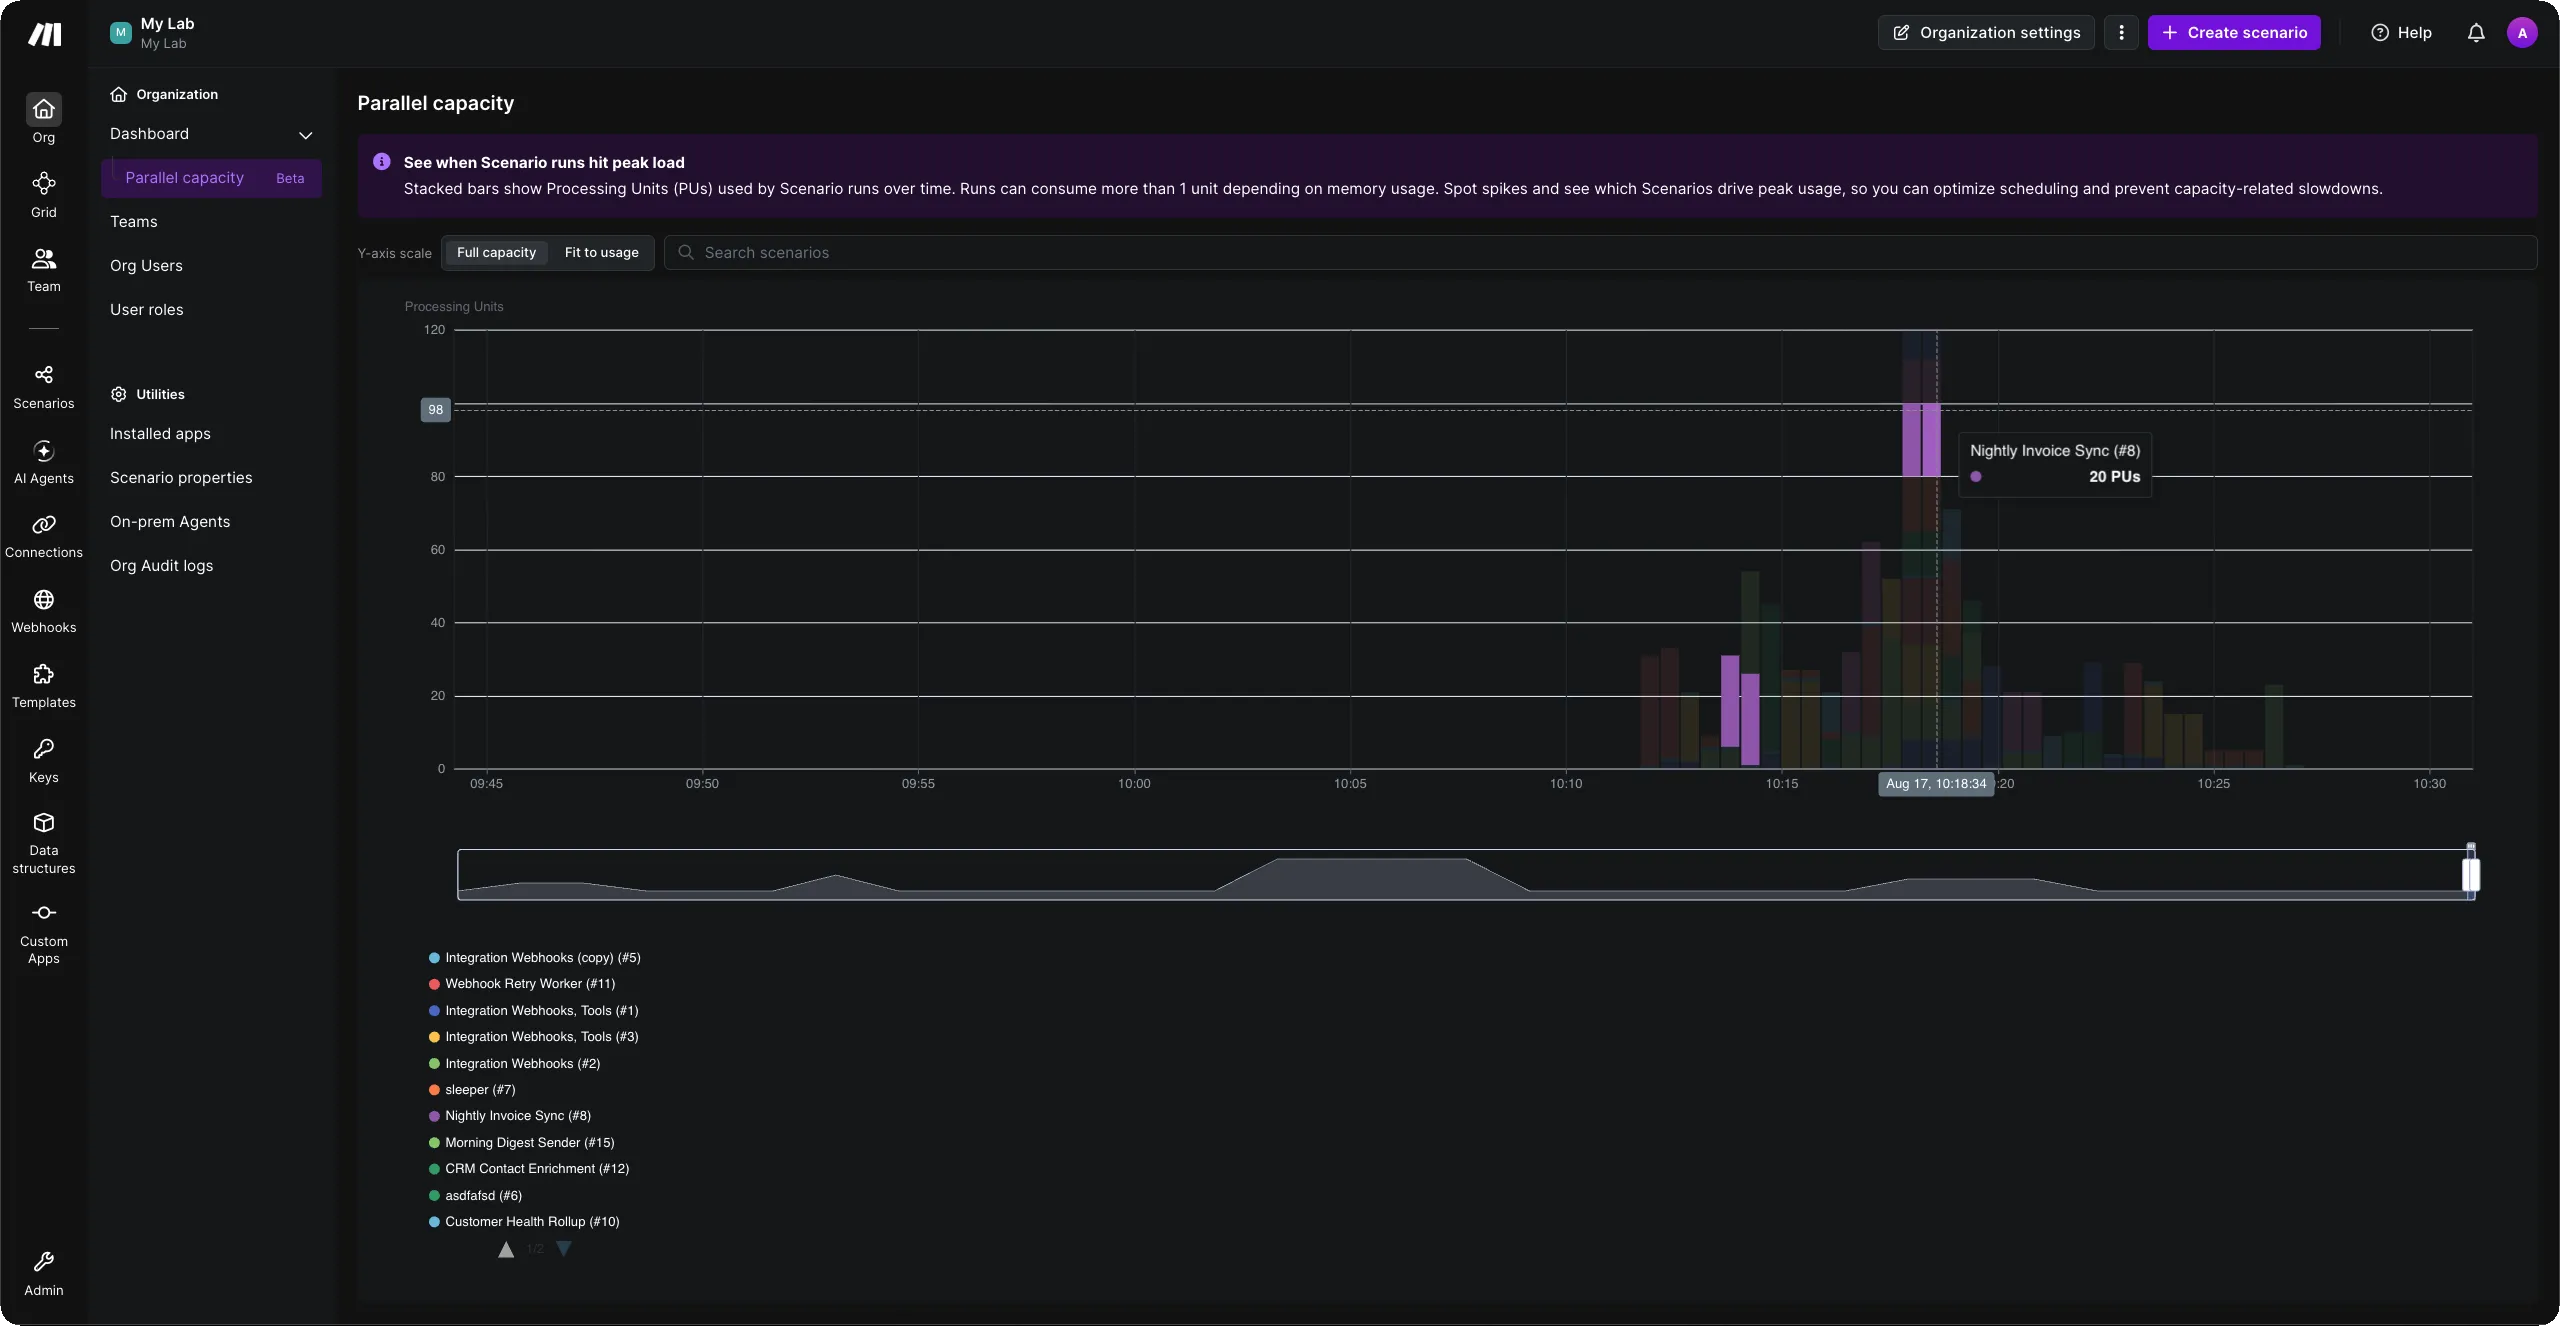
How to read the chart
The chart shows your capacity usage as stacked bars over time:
- Each stacked bar is one point in time, and each color in the bar is a different scenario.
- The height of the bar is the total processing units in use at that moment.
- Hover over a bar to view the exact number of processing units a scenario used at that time.
- Use the legend below the chart to identify scenarios, and the search field to filter to the ones you care about.
- Drag the handles on the slider below the chart to zoom into a shorter period, or to zoom out across several days.
- Drag the slider selection or the chart to move backward and forward in time.
Full capacity and Fit to usage
The Y-axis scale control changes what the chart is measured against:
- Full capacity shows the axis up to your organization's limit, so you can view how much headroom you have left.
- Fit to usage scales the axis to your actual usage, which makes smaller peaks easier to read.
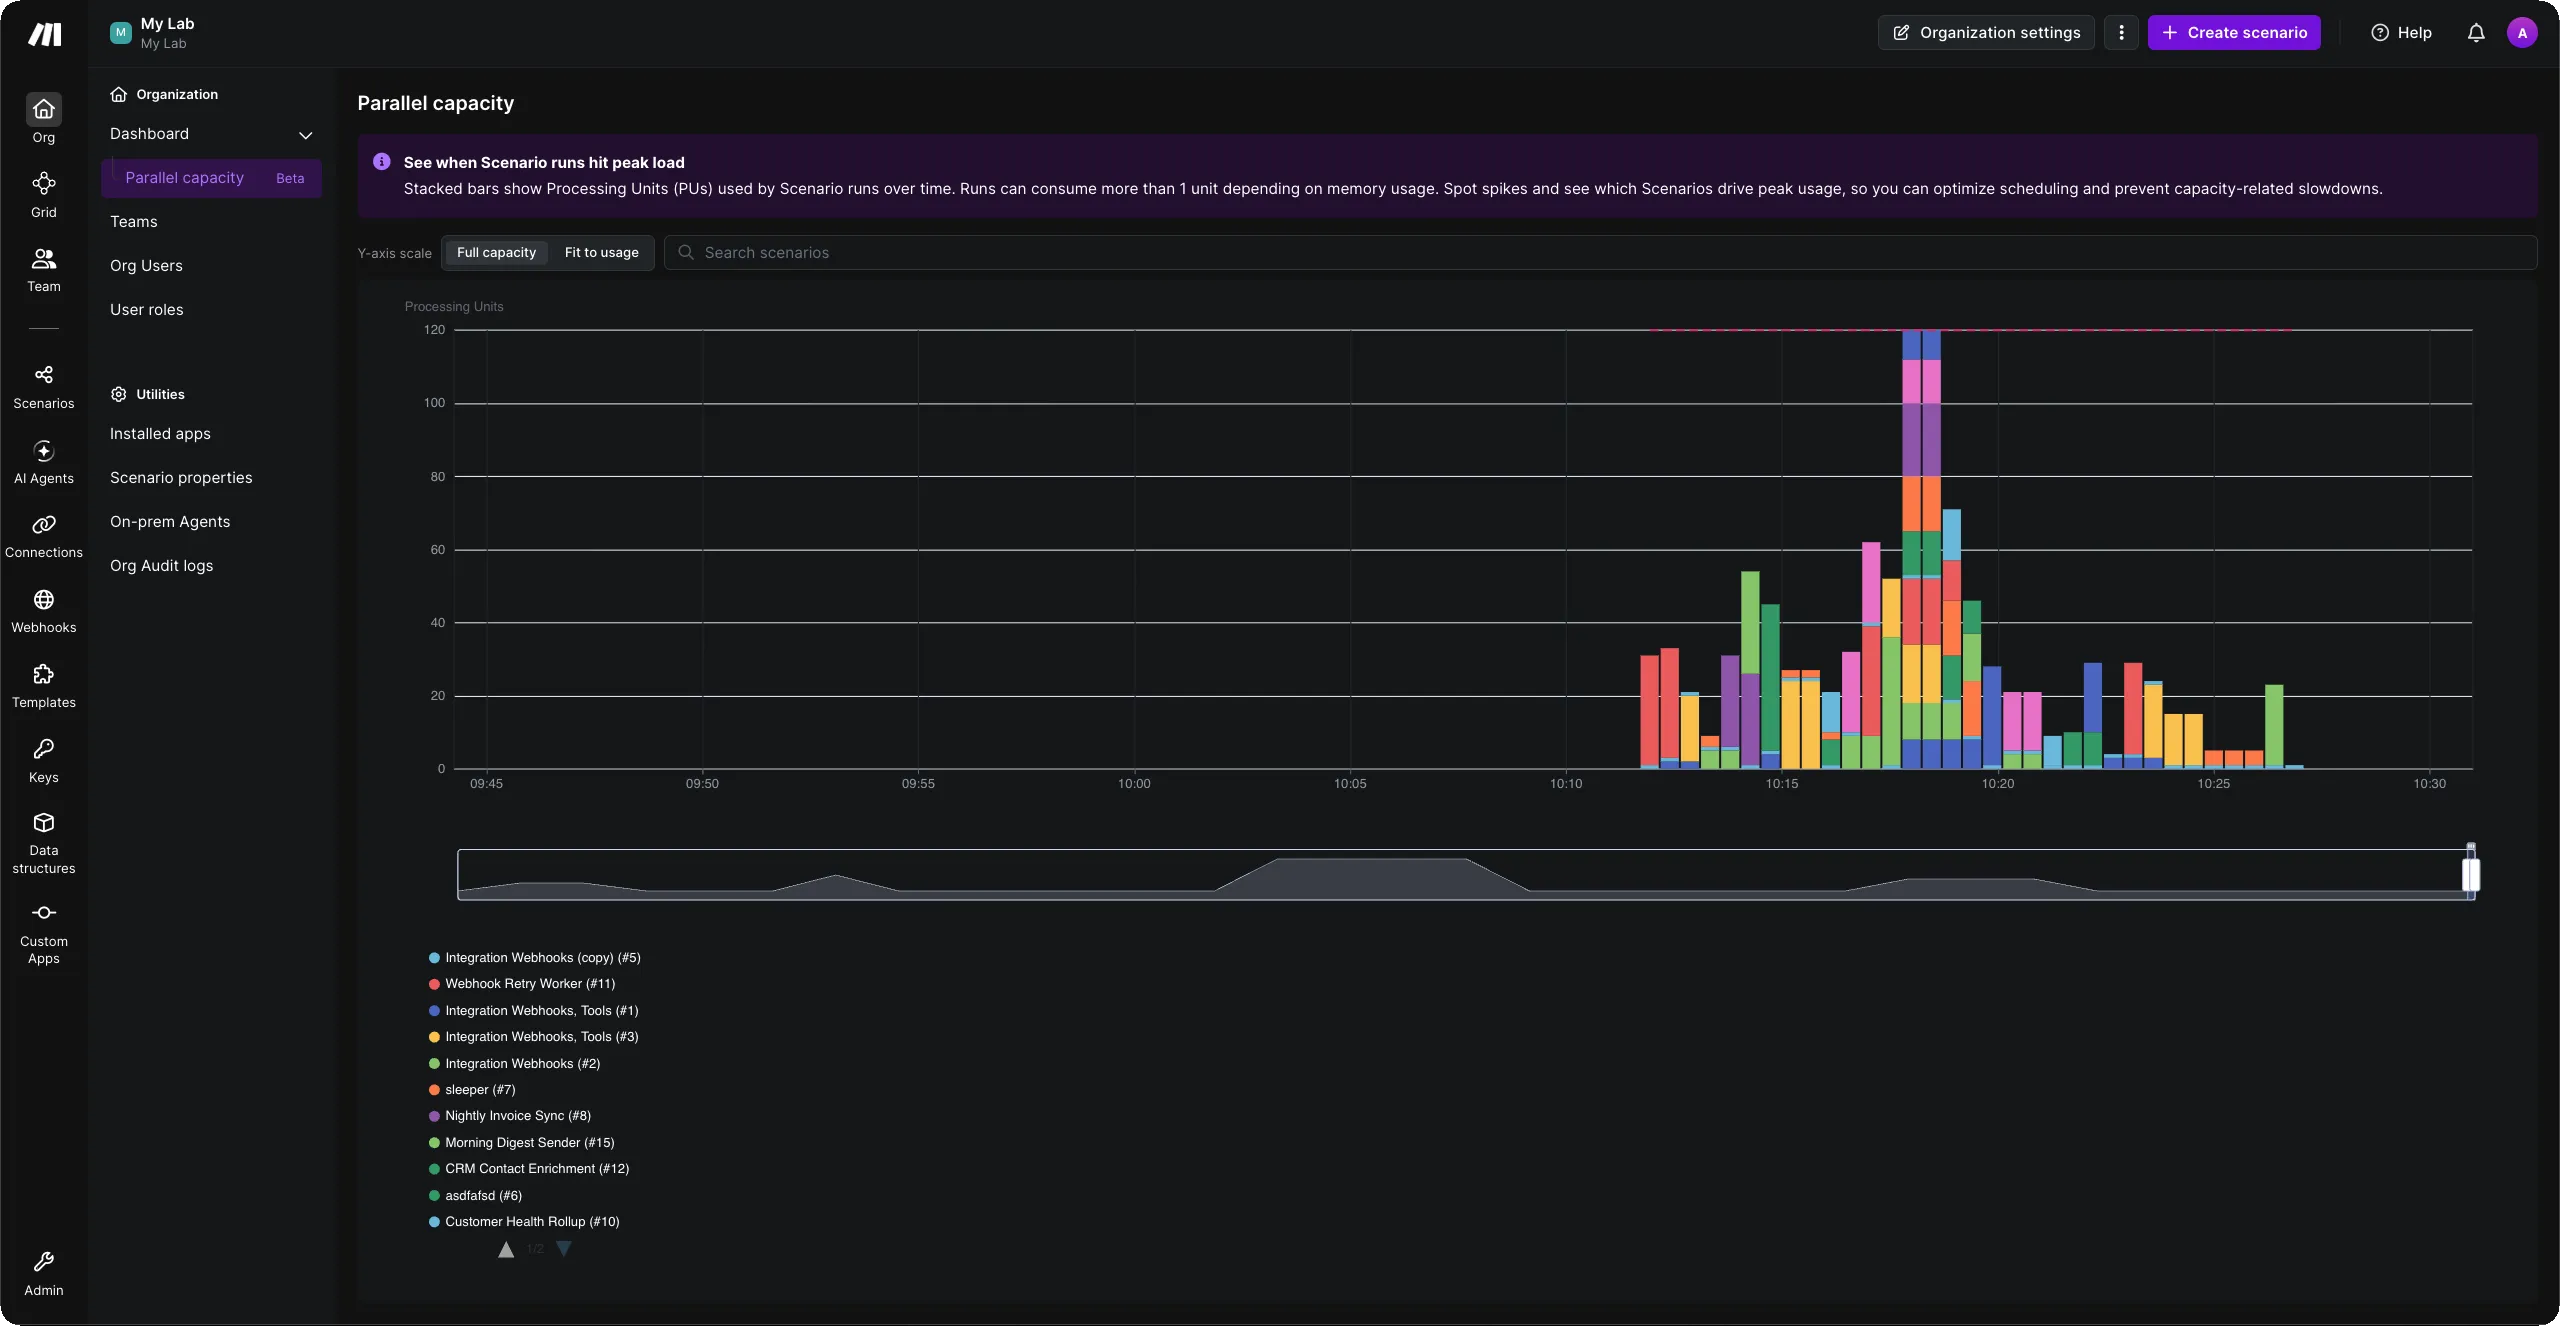
When your usage reaches the top of the chart in Full capacity view, a line appears at the limit. Bars that touch that line mean your organization was at full capacity, and Make delayed or rejected new runs at that moment.
Spotting patterns over time
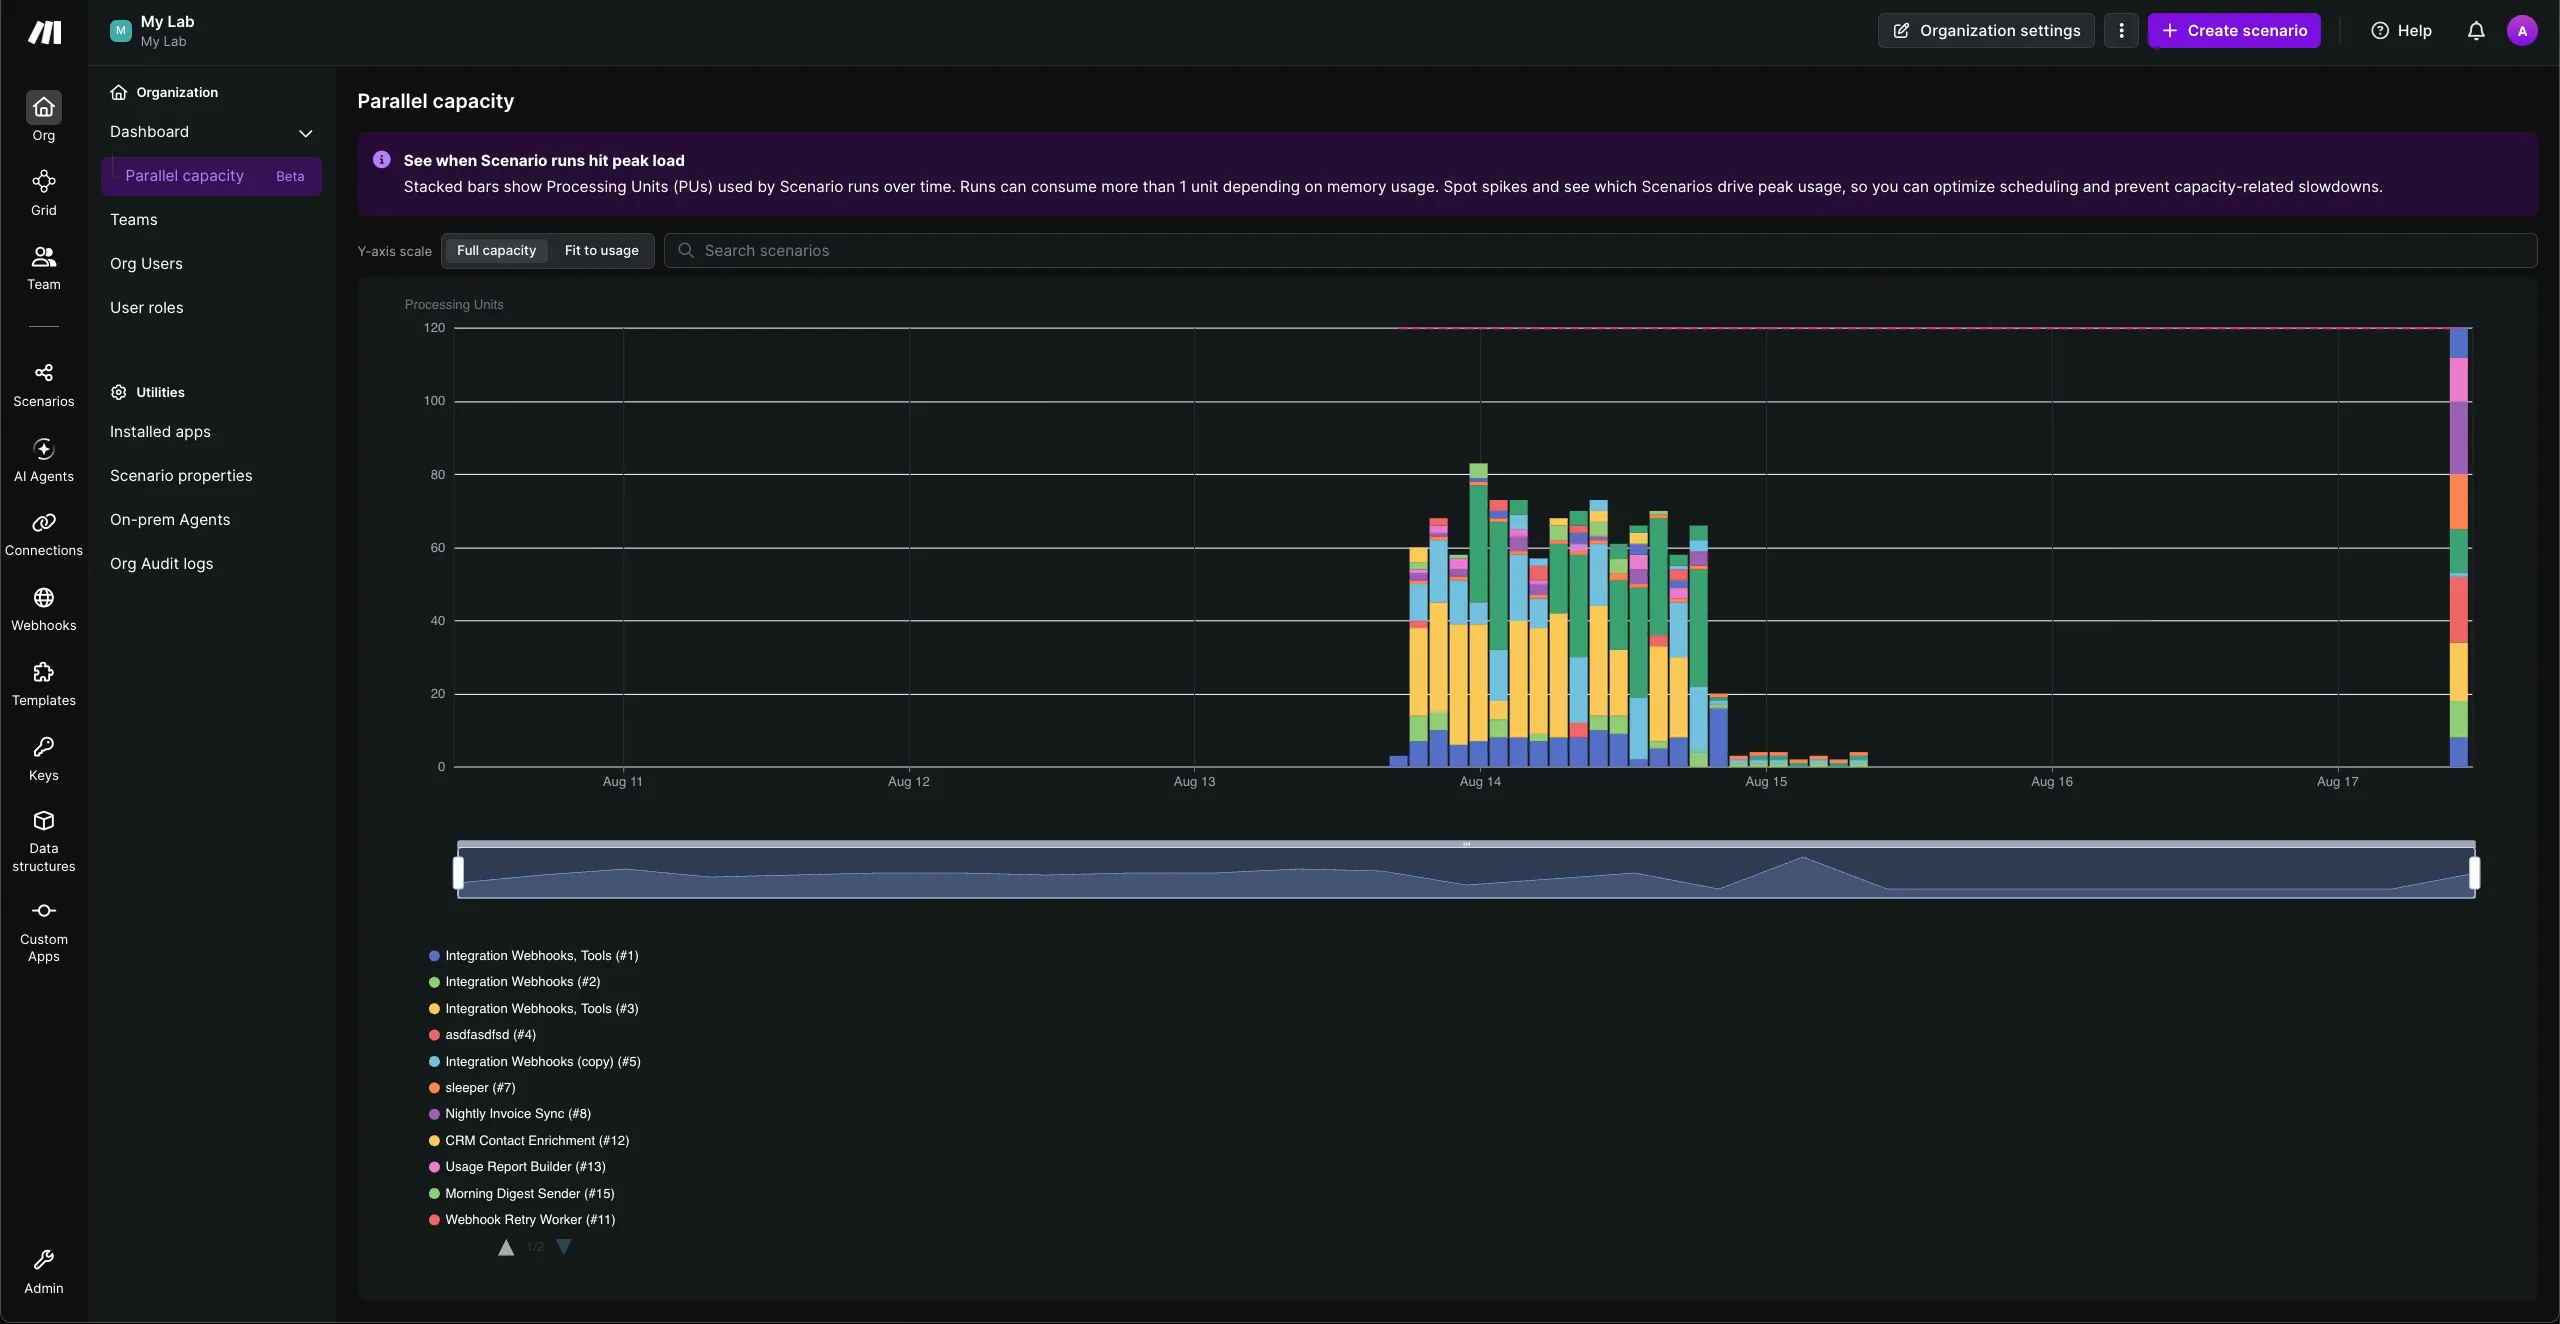
Zoom out to several days to spot recurring peaks, for example a nightly sync or a weekly report that consistently pushes you to your limit. These scenarios are usually the best candidates for rescheduling.
What happens when you reach your limit
In many cases you see a delay rather than an error. The behavior depends on the type of scenario.
Type of scenario | Is data queued? | What happens |
|---|---|---|
Instant, with a webhook response module, or on-demand scenarios such as subscenarios | No | Make responds to the caller with status 429 and the message Too many executions running in parallel on organization level. If the caller doesn't retry, Make doesn't process the data. For webhooks, Make stores an error log. |
Instant, without a webhook response module | Yes | Make queues incoming data and processes it as capacity becomes available. No error, though you may notice delays. |
Scheduled | No | Make delays the next scheduled run until capacity is available. The delays can be longer than for instant scenarios, but this doesn't cause an error. |
Make can't queue responsive scenarios without changing the behavior you designed into the scenario, so it tells the caller to retry later instead of failing silently.
If one of your scenarios calls another scenario that can be rate-limited, add error handling to the calling scenario. The simplest option is to enable Incomplete executions and retry manually, or to pair them with an error handling route that uses Retry error handler to resolve failed runs automatically.
Scenario rate limits
You can set a maximum number of runs per minute for any instant scenario in its schedule settings. A rate limit protects a third-party API that has its own rate limits, and keeps a high-volume scenario from consuming your whole organization's capacity.
When you exceed this rate limit, Make behaves the same way as when you reach your organization's parallel capacity, but with a different message. Responsive scenarios receive status 429 with Too many requests for scenario, and non-responsive instant scenarios queue the data instead.
If a scenario is unexpectedly slow to collect new data, check its schedule settings first. A rate limit set some time ago is a common cause.
Reduce peak load
If you regularly reach your limit, the goal is to spread the same work across a longer period rather than running everything at once. Start with two changes that don't require reworking your scenario logic:
- Rate-limit your less time-sensitive scenarios so your critical ones have more headroom.
- Stagger your triggers by processing data in smaller batches, or by adding a short delay between them.
Memory
Runs that use more memory take more processing units, so trimming the data your scenario carries has a direct effect on your capacity.
Start by avoiding repeated data. A common example is selecting all values in an aggregator when you only need a few of them, which means every bundle carries fields you never use.
If your scenario is already lean, process your data in smaller batches instead, or spread its schedule so it doesn't consume all your processing units at once.
Processing power
Large iterations and aggregations are convenient, but they can use a lot of processing power and memory. They often slow a scenario down more than necessary for the result you're after, and a slower run holds capacity for longer.
For complex data transformations, try replacing a long iterate-and-aggregate chain with the Make Code app. A small script is often faster and uses fewer resources and credits than the equivalent chain of modules.
Subscenarios
If a subscenario takes too many processing units, batch the data you send to it. Instead of one run per item, send a group of items to a single run.
Consider the trade-off. Each run takes longer and may take more processing units, because it handles more data and therefore uses more memory and processing power. In exchange, you get a much lower overall number of runs, which usually causes the peaks that push you toward your limit.
Another approach is to move some or all of the subscenario logic into the parent scenario. The parent consumes more processing power and memory, and its runs take longer, but this change reduces your overall number of runs.
Webhooks
Non-responsive webhooks
For scenarios that don't need to react instantly, switch to a scheduled webhook. Make collects the data as it arrives and processes it on your schedule, which moves the work away from your busiest moments.
Responsive webhooks
If your scenario needs to respond to a webhook, make it as quick as possible. The longer the run takes, the longer it holds capacity, and Make can't queue responsive scenarios when you reach your limit.
If you need to do more work after responding, save the webhook data to a data store and process it later in batches through a separate scenario. This approach keeps your response fast and helps you avoid limits when a lot of data arrives during a peak of activity.
Check your work
Use the Parallel capacity dashboard to confirm the change worked. After you reschedule, batch, or rate-limit a scenario, the same period shows a lower, flatter set of bars.